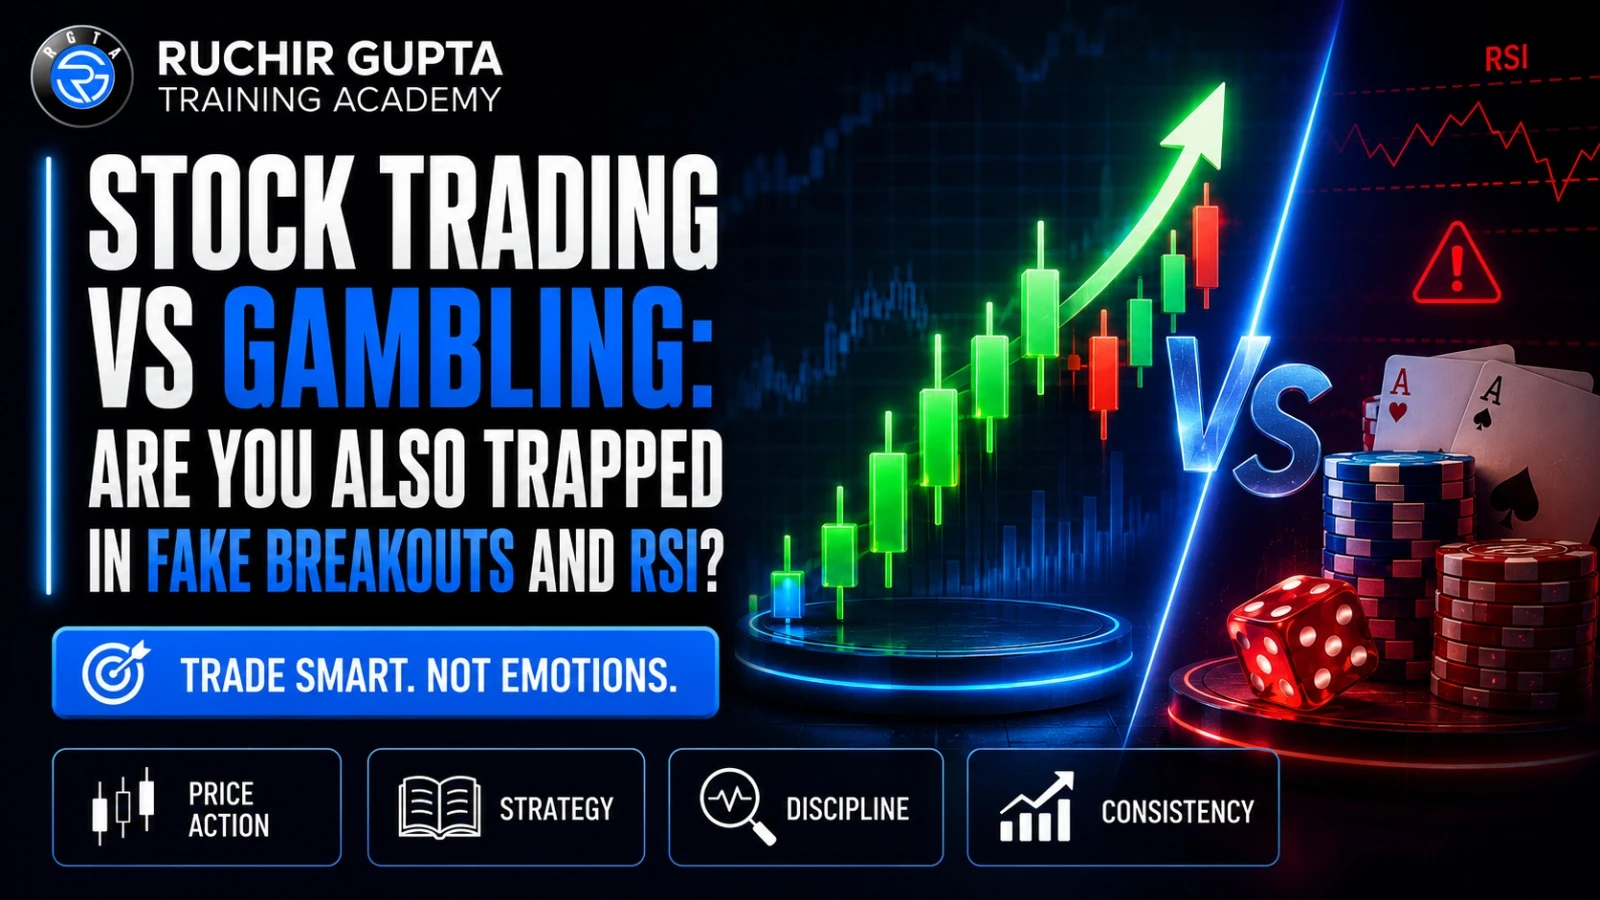
Stock Trading vs Gambling: Are You Also Trapped in Fake Breakouts and RSI? | Ruchir Gupta
If you are active in stock trading, futures & options (F&O), or even long-term investing, one thing matters more than most traders realize:
How much does a stock actually move?
Most people carefully compare returns before investing money in a bank FD. Even a 0.25% higher return influences decisions.
But strangely, when it comes to trading, many people enter stocks without analyzing their movement potential, direction, volatility, or cycle behavior.
That is one of the biggest reasons why traders slowly turn trading into gambling.
This is where the real debate around stock Trading vs Gambling begins.
Many traders randomly enter stocks because:
- Someone on TV recommended it
- A YouTube video created excitement
- Social media influencers hyped the stock
- News channels pushed breaking headlines
- Telegram groups promised “sure-shot profit”
Then what happens?
The stock immediately moves in the opposite direction.
The trader panics.
They exit in fear.
Then they jump into another random trade.
This cycle repeats again and again.
The real problem is not always the trader.
Sometimes traders were simply never taught the right process.
A structured trading method changes everything:
- You understand direction beforehand
- You hold trades with confidence
- You avoid emotional panic
- You stop chasing random stocks
- You learn proper risk management
Experienced market mentor Ruchir Gupta often emphasizes that markets reward discipline, planning, and structured analysis — not emotional reactions.
In this detailed guide, you’ll learn:
- The difference between stock trading and gambling
- What is RSI in stock market trading
- How fake breakouts trap traders
- Why direction matters more than predictions
- RSI trading strategy explained
- How professional traders manage risk
- Why psychology destroys most traders
- How to avoid emotional and random trading
Quick Answer
Is Stock Trading Gambling?
No, stock trading is not gambling when traders use proper analysis, risk management, and structured strategies. However, trading becomes gambling when decisions are based on emotions, random tips, fake breakouts, overtrading, or blindly using indicators like RSI without understanding market direction.
Stock Trading vs Gambling Explained
At first glance, trading and gambling may look similar.
Both involve money.
Both involve risk.
Both involve uncertainty.
But in reality, professional trading is completely different from gambling.
What Is Professional Stock Trading?
Professional stock trading is based on:
- Market structure
- Probability
- Technical analysis
- Risk management
- Discipline
- Position sizing
- Emotional control
A trader follows a defined process before entering any trade.
What Is Gambling in Trading?
Trading becomes gambling when traders:
- Enter trades randomly
- Chase social media hype
- Trade emotionally
- Ignore stop-losses
- Overtrade after losses
- Depend only on luck
Without structure, even technical indicators become dangerous.
Stock Trading vs Gambling Comparison Table
Factor | Professional Trading | Gambling |
|---|---|---|
Entry Method | Planned | Random |
Strict | Ignored | |
Psychology | Controlled | Emotional |
RSI Usage | Confirmation tool | Blind signal |
Position Size | Calculated | Overleveraged |
Trade Selection | Structured | Hype-driven |
Goal | Consistency | Fast money |
Market Understanding | Deep | Superficial |
Why Direction Matters in Trading
The biggest problem most traders face is:
Understanding market direction.
Without direction, traders panic.
With direction, traders gain confidence.
Real Market Example
Suppose:
Maruti Suzuki generally moves around 10–12%
Another stock moves 20% during the same period
Which stock attracts traders more?
Naturally, traders prefer stronger movement potential.
Now think about options trading.
If a stock moves 10–12%, option premiums can sometimes move:
3x
4x
Even 5x
This happens because options amplify underlying stock movement.
But the key is:
You must understand the cycle and direction before the move starts.
Professional traders plan early instead of reacting emotionally later.
Why Most Traders Enter Stocks Randomly
Many retail traders buy stocks because:
- News channels discussed it
- Influencers promoted it
- Twitter became bullish
- Friends recommended it
- Telegram groups created urgency
This creates emotional trading behavior.
Then the moment traders enter, the stock falls.
Why?
Because there was no structured method behind the trade.
What Is RSI in Stock Market?
The RSI indicator (Relative Strength Index) is one of the most popular momentum indicators used in stock market technical analysis.
It measures momentum and speed of price movement.
RSI=100−1001+RSRSI = 100 – \frac{100}{1 + RS}RSI=100−1+RS100
Where:
- RS = Average gain / Average loss
- RSI ranges from 0 to 100
RSI Indicator Explained for Beginners
RSI Levels
RSI Level | Meaning |
Above 70 | Overbought |
Below 30 | Oversold |
Around 50 | Neutral |
60–80 | Strong bullish momentum |
20–40 | Strong bearish momentum |
What Is RSI in Stock Market Used For?
The Relative Strength Index indicator helps traders identify:
- Momentum strength
- Overbought conditions
- Oversold conditions
- Trend continuation
- Divergence signals
- Potential reversals
But here’s the important truth:
RSI alone cannot make you profitable.
Professional traders combine RSI with:
- Price action
- Volume
- Support and resistance
- Trend structure
- Market cycles
The Biggest Mistake Traders Make With RSI
Many beginners think:
- RSI above 70 = Sell
- RSI below 30 = Buy
This oversimplification destroys accounts.
In strong trends:
- RSI can remain overbought for weeks
- RSI can remain oversold for extended periods
This is why understanding direction matters more than blindly following indicators.
Fake Breakout Trading: The Biggest Retail Trap
One of the most dangerous patterns in stock trading is the fake breakout.
What Is a Fake Breakout?
A fake breakout happens when:
Price breaks resistance briefly
Retail traders enter aggressively
The move fails suddenly
Price reverses sharply
This traps emotional traders.
Why Fake Breakouts Happen
Professional traders understand retail psychology.
Retail traders often:
Chase green candles
Enter late
Ignore volume
Ignore broader market context
Institutional traders use this liquidity.
Common Fake Breakout Signs
1. Weak Volume
Strong breakouts usually require institutional participation.
Low-volume breakouts often fail.
2. RSI Extreme Readings
If RSI is extremely overbought near resistance, caution is necessary.
3. No Retest Confirmation
Healthy breakouts often retest resistance as support.
Fake breakouts collapse quickly.
4. Emotional Buying
The moment traders buy because “everyone is bullish,” risk increases.
Trading Psychology in Stock Market
Most traders believe losses happen because of:
- Wrong indicators
- Bad luck
- Market manipulation
But experienced traders know:
Psychology destroys more accounts than technical analysis errors.
Emotional Mistakes Traders Make
Emotion | Result |
Fear | Early exits |
Greed | Overtrading |
Revenge | Bigger losses |
Hope | Ignoring stop-loss |
FOMO | Chasing bad entries |
Why Traders Panic
When traders don’t understand direction:
- They lose confidence quickly
- They exit trades emotionally
- They jump into another stock
- They repeat mistakes again
This creates a dangerous cycle of random trading.
RSI Trading Strategy for Smart Traders
The best RSI trading strategy is not about predicting every move.
It is about improving probability.
Step-by-Step RSI Trading Strategy
Step 1: Identify Trend
Trade in the direction of the broader trend.
Step 2: Mark Support & Resistance
RSI works better near important levels.
Step 3: Wait for Confirmation
Avoid instant entries.
Look for:
Volume confirmation
Candle structure
Retests
Momentum continuation
Step 4: Use Proper Stop-Loss
Never enter trades without defined risk.
Step 5: Maintain Risk-Reward Ratio
Aim for:
Minimum 1:2 risk-reward
Preferably 1:3
RSI Divergence Strategy
Professional traders also use RSI divergence.
Bullish Divergence
Price makes lower lows
RSI makes higher lows
Possible bullish reversal signal.
Bearish Divergence
Price makes higher highs
RSI makes lower highs
Possible bearish reversal signal.
Stock Movement and Volatility Matter
If you trade F&O or equity, understanding movement is critical.
Some stocks move slowly.
Some move aggressively.
Volatility creates opportunity.
For example:
- A stock moving 20% creates larger trading opportunities
- Option premiums can multiply rapidly during strong directional moves
This is why professional traders study:
- Volatility
- Cycles
- Trend strength
- Market structure
Instead of blindly entering random stocks.
The Dangerous Habit of Averaging Losses
One of the biggest reasons traders face financial damage is:
Endless averaging.
Especially in futures trading.
Traders think:
“The market will eventually reverse.”
Sometimes it doesn’t.
This creates:
Large drawdowns
Margin pressure
Emotional breakdowns
Capital destruction
Risk Management: The Real Survival Skill
At Ruchir Gupta Training Academy, strong emphasis is placed on:
- Discipline
- Risk control
- Capital protection
- Structured trading systems
Because no strategy wins 100% of the time.
Even if a method works 8 out of 10 times, losses still happen.
The goal is consistency — not perfection.
Professional Risk Management Rules
1. Risk Small Per Trade
Professional traders rarely risk large percentages on one trade.
2. Accept Losses Quickly
Losses are business expenses in trading.
3. Avoid Overleveraging
Large leverage destroys emotional control.
4. Never Chase Recovery Trades
Revenge trading creates bigger losses.
5. Protect Capital First
Without capital, no future opportunity exists.
The Market Cannot Be Conquered by Greed
One of the most important lessons in trading is:
You cannot take everything from the market.
The market gives opportunities gradually.
Trying to capture “all profits” often leads to repeated losses.
A simple analogy:
Trading is like collecting rainwater with your hands.
You can collect some.
You cannot capture the entire rainstorm.
Greedy traders eventually lose discipline.
Disciplined traders survive long-term.
Why Structured Learning Matters
Many traders are not failures.
They simply never learned:
- Market structure
- Risk management
- Emotional control
- Proper trade selection
- Direction analysis
That is why structured education matters.
Ruchir Gupta has trained lakhs of traders using practical, experience-driven approaches focused on:
- Technical analysis
- Trading psychology
- Scanner-based trade selection
- Risk management
- Systematic trading methods
The Best Stock Market Course Online – Ruchir Gupta focuses on helping traders build confidence through structured learning instead of emotional speculation.
Students learn:
- How to identify direction
- How to avoid fake breakouts
- How to use RSI correctly
- How to control emotions during volatile markets
Conclusion
The difference between stock Trading vs Gambling is not luck.
It is preparation.
Gamblers react emotionally.
Professional traders prepare systematically.
Indicators like RSI are useful tools, but without discipline, psychology control, and risk management, even the best indicators become dangerous.
The market rewards:
- Patience
- Planning
- Structured analysis
- Emotional control
- Risk management
It punishes:
- Greed
- Random trading
- Overconfidence
- Emotional decisions
If you genuinely want long-term success in stock trading, focus less on shortcuts and more on building a professional process.
Learning from experienced mentors like Ruchir Gupta and joining structured programs such as the Best Stock Market Course Online – Ruchir Gupta can help traders shift from emotional speculation toward disciplined, confidence-based market decision-making.
Course and academy information referenced from uploaded materials.
Search Definitions
What is RSI in stock market?
RSI (Relative Strength Index) is a momentum indicator used to measure the strength and speed of price movement in stock market trading.
What is fake breakout trading?
Fake breakout trading refers to situations where price temporarily breaks support or resistance but quickly reverses, trapping traders.
What is overbought and oversold RSI?
RSI above 70 is generally considered overbought, while RSI below 30 is considered oversold.
People Also Ask
Is stock trading safer than gambling?
Yes, when done with proper analysis, discipline, and risk management.
Why do traders lose money using RSI?
Because many traders use RSI blindly without understanding trend, volume, and market structure.
Can fake breakouts be avoided?
Not completely, but confirmation techniques can reduce risk significantly.
Is RSI good for intraday trading?
Yes, especially when combined with volume and support-resistance analysis.
FAQs
Is stock trading safer than gambling?
No, not when done with strategy and discipline.
What is RSI in stock market?
RSI is a momentum indicator used to measure market strength and momentum.
What is the best RSI setting?
The standard setting is 14.
Can RSI predict market direction?
No. RSI helps analyze momentum, not predict certainty.
Why do fake breakouts happen?
Because of emotional retail participation and lack of confirmation.
Is RSI good for beginners?
Yes, but it should be combined with price action and risk management.
Why do traders panic during losses?
Mostly due to lack of planning and emotional attachment.
What is the biggest mistake in futures trading?
Overleveraging and endless averaging during losses.
How do professional traders manage risk?
By using stop-losses, position sizing, and disciplined execution.
How can beginners learn trading properly?
By learning structured trading methods from experienced mentors and practicing disciplined execution.