
Is there any mathematical relationship between numbers which can help you find out potential turning points in the market?
The Gann Square of 9 is a traditional form of technical analysis using square roots and angle calculations to find out potential support, resistance and reversal levels.
Many markets like the NIFTY 50, Bank Nifty and individual stocks often have reversals, breakouts and consolidation. By using the Gann Square of 9 you can work out key levels ahead of time.
But it’s not just about working out the levels you need to know what price to use, how to interpret them and when to avoid trading.
Let’s look into how this method can be used.
Quick Answer: What Is Gann Square of 9?
The Gann Square of 9 is another tool used within technical analysis. It uses a spiral pattern and square root calculations to forecast possible support and resistance.
Traders will take the square root of a base price and multiply by an angle and then again to make a square. This gives them reference points.
What Is Gann Square of 9?
Gann Square of 9 is a mathematical trading tool developed by legendary trader W.D. Gann. Numbers are placed into a square and form spirals. This results in a number of angles including 45°, 90°, 180° and 360°.
These angles and square root calculations can then be used to identify possible price levels.
Key features:
- Can be used to identify potential support and resistance levels.
- Can be used for stocks, indices and more.
- Angles of 45°, 90°, 180° and 360°.
- A useful tool to help price action and other indicators.
Unlike traditional support and resistance levels, this uses mathematical calculations to identify levels.
How does the Gann Square of 9 work?
The most common way to calculate it is by adding or subtracting 2 from the square root of a base price every 360 degrees.
| Angle | Square Root Adjustment |
| 45° | +0.25 |
| 90° | +0.50 |
| 135° | +0.75 |
| 180° | +1.00 |
| 225° | +1.25 |
| 270° | +1.50 |
| 315° | +1.75 |
| 360° | +2.00 |
If we take a base price of ₹100, we get 10. We can add 0.50 to give us a price of ₹110.25 (projected up 90°). Or we can subtract 0.50 to get a price of ₹90.25.
These are completely ignoring any news, liquidity or pressure. They are not necessarily reversal points.
Gann Square of 9 Formula
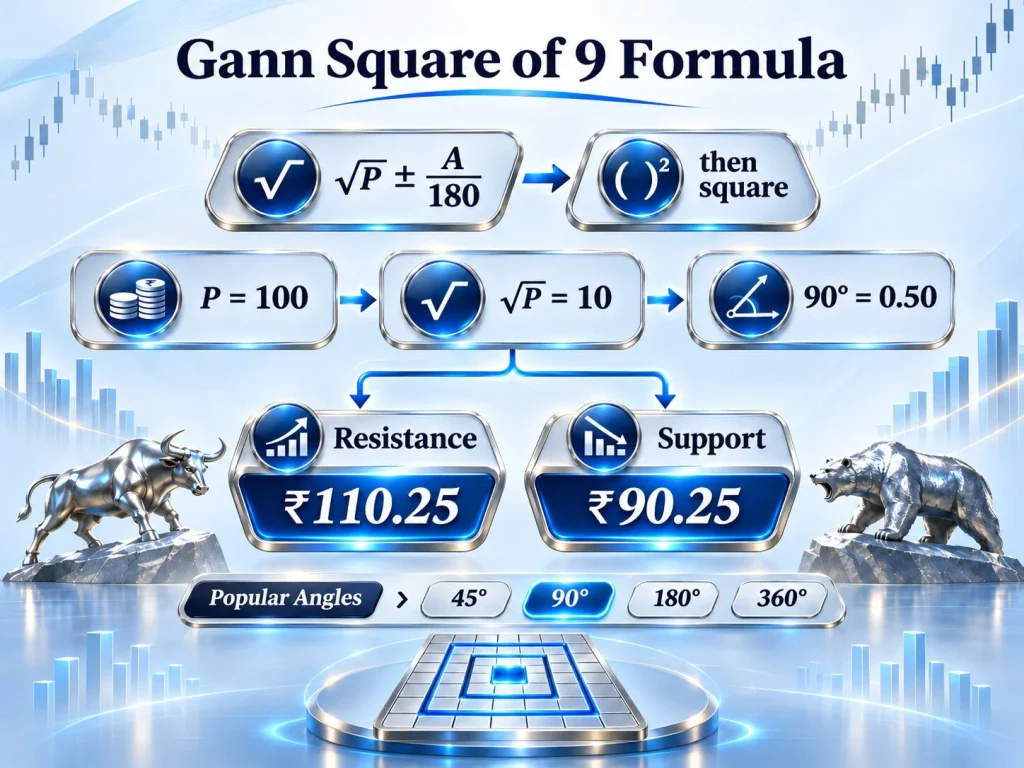
The Gann Square of 9 formula uses the square root of the selected reference price.
The following is the commonly used formula:
Resistance:
Resistance=P+A1802
Support:
Support=P-A1802
Where,
- P = Reference Price/Pivot Price
- A = Selected Angle (in degrees)
- √P = Square Root of Reference Price
- A/180 = Angle adjustment
Example: If the reference price is ₹100 and selected angle is 90°
Step 1: Square Root of Reference Price
100=10
Step 2: Angle Adjustment
90/180=0.50
Step 3: Resistance Calculation
Resistance=(10+0.50)2
Resistance = ₹110.25
Step 4: Support Calculation
Support=(10-0.50)2
Support = ₹90.25
The above formula can be applied using different angles to get all sets of prices.
How to Calculate Gann Square of 9
Let us consider a hypothetical stock price of ₹100
Step 1: Determine the base
Let us consider that ₹100 is an important swing low and the stock has started to recover from there.
Step 2: Calculate square root
Square root of 100 = 10
Step 3: Choose angles
Choose 45°, 90°, 135°, 180°
Step 4: Calculate using the formula
Add angle to square root value and then square the result to get the resistance levels.
Gann Square of 9 Calculation
| Angle | Resistance | Support |
| 45° | ₹105.06 | ₹95.06 |
| 90° | ₹110.25 | ₹90.25 |
| 135° | ₹115.56 | ₹85.56 |
| 180° | ₹121.00 | ₹81.00 |
| 225° | ₹126.56 | ₹76.56 |
| 270° | ₹132.25 | ₹72.25 |
| 315° | ₹138.06 | ₹68.06 |
| 360° | ₹144.00 | ₹64.00 |
Note: Values used here are rounded off to 2 decimal points.
How to Use These Levels As A Trader?
Say for example the stock price has been fluctuating between ₹100 and ₹110.25.
You as a trader can see:
- If the stock price approaches ₹110.25 and faces selling pressure, it can act as a resistance.
- If the stock price breaks higher through ₹110.25 on high volumes, then we can watch the next level.
- If the stock price breaks higher and tests the level, then the previous resistance can act as a possible support zone.
This considers the mathematics of the levels as well as real world market movements.
How To Use A Gann Square Of 9 Calculator
A Gann Square of 9 calculator will help to simplify the process.
You just need to add the price that you wish to use as your base price and select the angles required.
How to use the Gann Square of 9 calculator:
- Add the base price – This should be a swing high or swing low or closing price.
- Select the angle – A popular choice is 45, 90 or 180.
- Select the number of levels to calculate.
- The calculator will return the projected levels.
- Plot the levels on your chart – This can be done using your charting platform. Compare the levels with the actual price.
- Wait for confirmation from price action, volume and momentum.
What to consider Before Using a calculator:
| Parameter | Consideration |
| Base price | Ensure it’s an obvious swing high or low. |
| Angle | Start with major angles 90 and 180. |
| Timeframe | Ensure you’re using daily, hourly or intra-day charts. |
| Price accuracy | Take into account the tick size of the instrument. |
| Confirmation | Volume and price action. |
| Risk management | Stop loss and position size. |
Some popular options available online are the Square of 9 calculator by Strike. Ensure you understand how the calculator works and what scaling it uses as they can vary.
Gann Square of 9 Trading Strategy
Once you’ve got your levels, here are a few strategies you can use:
1. Support/Resistance
Identify your pivot point and calculate your levels. Look for signs of rejection and reversal. Identify your invalidation level.
A shorting opportunity here as there is a bearish rejection candle forming at ₹121. However, there is only 1 candle so we would want to put a stop loss in.
2. Breakout
Look above ₹110.25 for a strong closing candle, high volume and strong momentum. This could be our next level to target.
However, the volume isn’t great. It could be a fake breakout.
3. Using Indicators With Gann Levels
| Indicator | Reason |
| RSI | Shows momentum. |
| Moving Averages | Shows overall trend. |
| Volume | Shows how involved. |
| Fibonacci Retracement | Shows more levels to retrace. |
| Candlestick | Shows potential for rejection. |
If there are any overlaps between historical areas and Gann levels then this is something to note. However it is not guaranteed.
Advantages and Disadvantages of the Gann Square of 9
| Advantages | Disadvantages |
| Predictable | Not always accurate. |
| Helps identify possible areas | Very dependent on what base price is used. |
| Can be used with a variety of instruments. | Confirmation from market needed. |
| Provides an alternative to random targets. | Different calculators may be scaled differently. |
| Can be a useful tool when used with other forms of chart analysis. | Can be quickly invalidated if there is high volatility. |
Depending on what price you start at, different projections will be made. Be consistent with your choice of pivots and back test with different market scenarios.
Common pitfalls to watch out for
1. Make sure that you do not add random prices: You should always use sensible market prices (Market Pivot).
2. This is just a zone so it will not be pinpoint: So a 100% reversal cannot be guaranteed.
3. Do not forget the trend: If there is a strong trend this can go through multiple resistance/support levels.
4. Do not over cluster: Having too many levels can cause confusion.
5. Do not forget volume: This may not get enough people involved.
6. Do not trade without stop-losses: There is no mathematical way to take away market risk.
7. Do not forget back-testing: Try trading this system on different stocks in different market conditions and timeframes.
Learn Technical Analysis from Ruchir Gupta
Knowing how to use technical indices is very important.
We offer a course with materials, live examples and mentoring from Ruchir Gupta.
- Technical Analysis: Candlesticks Patterns Charting Support Resistance
- Gann: Geometric Price Relationships GCD Time Cycle Method
- Intraday Trading Strategies: Price Action Volume
- Options: Option Premiums Strike Selection Risk Management
- Live Trading Analysis: Rule Based Strategy
This will give you a solid base of understanding Technical Analysis. We focus on timing the market.
Look at our stock market courses. We have intraday, options and technical analysis. We offer live training.
Conclusion
The Gann Square of 9 is a method to calculate possible support/resistance/price projection levels using square root and angular values. However, this should be used as a guideline.
Using this alongside price action, volume, back-testing and risk management will give you more accurate results.
Ruchir Gupta offers a course to teach you how to actually trade. The course includes intraday, options and technical analysis. We also offer live training.