
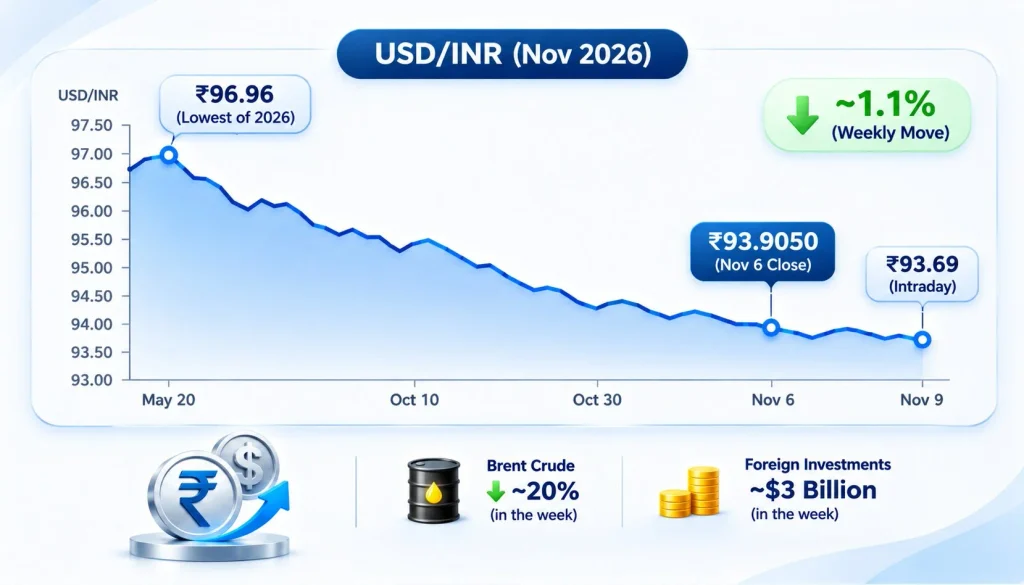
The Indian Rupee has bounced back recently after experiencing a month-long slump. It closed at 93.9050 on 6th Nov 2026, its strongest closing level since 22nd April. The Rupee weakened to a record intraday low of ₹96.96 per dollar.
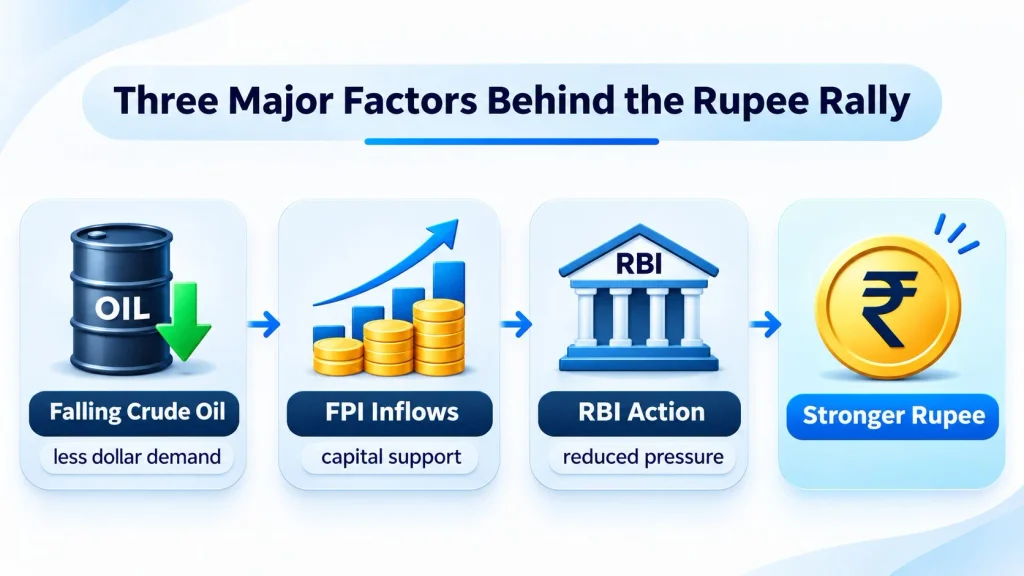
This rebound is being driven by three main factors:
- Falling crude oil prices: Crude oil prices are falling, so import costs have fallen.
- Foreign investment: Foreign investment is returning into India.
- RBI intervention: The RBI has taken steps to control the demand for dollars.
In addition to domestic factors, the Rupee has been heavily influenced by global factors. Understanding how these factors have impacted the Rupee will give insight into its future trajectory.
The Rupee is important for investors because any changes in the price will have an impact on inflation, company profits and import costs.
How can we look to continue this rebound and what should traders/investors be doing?
Quick Answer: Why Is the Indian Rupee Rising?
The Indian Rupee has gained against the US dollar on account of a drop in Brent crude oil prices, a fresh inflow of foreign portfolio investors (FPI) and RBI steps to control dollar demand.
Global sentiment too has played a role in boosting the recovery but higher yields in the US along with geopolitical uncertainties and importer demand will cap any further gains.
Indian Rupee Against Dollar – What Happened in November 2026?
There has been a notable shift in sentiment.
The rupee finished higher on November 6, trading at its highest level since April 22 at ₹93.9050, and rose around 1.1% over the course of the week, according to Reuters.
It rose further in early trade on November 9 to hit a high of ₹93.70 before finishing around ₹93.93.
Market Overview
| Indicator | Latest Figure |
| Nov 6 Close | ₹93.9050 |
| Nov 9 High | ₹93.70 |
| Nov 9 Close | Around ₹93.93 |
| Lowest of 2026 so far | ₹96.96 |
| Brent Crude Price | Down nearly 20% over the course of the week |
| Foreign investments in equities | Nearly $3 billion over the course of the week, according to Reuters |
Although there has been a notable bounce back in the Indian Rupee, the currency has not fully made up its losses for 2026.
Although it is a positive sign, traders should not get carried away with the bounce back.
How to Read the USD/INR Exchange Rate
The USD/INR exchange rate shows how many rupees are needed to buy one US dollar.
Simple definition: If USD/INR falls from ₹96 to ₹94, the rupee has appreciated. If it rises, the rupee will weaken.
| Movement | Meaning |
| ₹96 to ₹94 | Rupee appreciates |
| ₹94 to ₹96 | Rupee depreciates |
| Falling USD/INR | Rupee gains strength |
| Rising USD/INR | Dollar strengthens against the rupee |
Timeline: How Did the Rupee Recover?
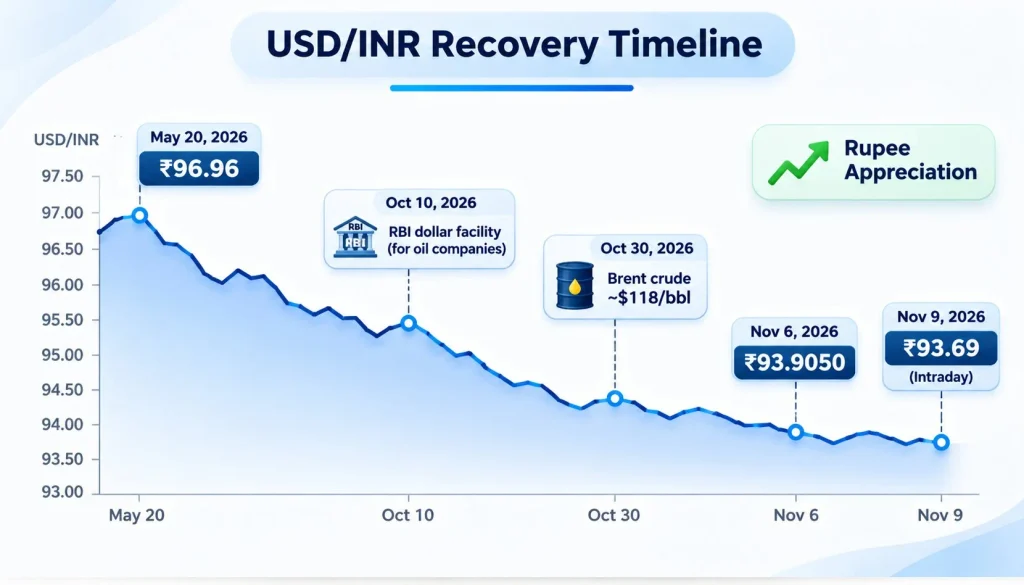
Selected market checkpoints:
| Date | USD/INR or market development |
| May 20, 2026 | Intraday low of ₹96.96; close at ₹96.82 |
| October 10, 2026 | RBI announced a special dollar facility for three public-sector oil companies |
| October 30, 2026 | Brent crude reached approximately $118 per barrel intraday |
| November 6, 2026 | Rupee closed at ₹93.9050, up 1.1% during the week |
| November 9, 2026 | Rupee touched ₹93.69 intraday but closed at ₹93.9275 |
Sources: Reuters, RBI and market reports. USD/INR figures are interbank levels, not RBI reference rates.
On November 9, state-run bank dollar purchases ended a six-session winning streak. Traders suspected RBI involvement, though this was unconfirmed.
Three Major Factors Behind the Rally
A. Crude Oil Price Declines
India imports almost 90% of its crude oil, which is mostly transacted in USD. Therefore higher crude oil prices create more demand for USD.
Brent crude peaked at around $118 on an intraday basis on 30th October. However, as of 10th November, crude has fallen to $90.99 (Reuters). This represents a roughly 23% decline. While fears of an escalation in conflict between the US and Iran have eased, there were still risk factors surrounding supply.
A stronger rupee would mean that payments made in US dollars would be cheaper.
Example:
An importer buys $100 million of crude oil.
| Exchange Rate | Import Cost |
| ₹96 per USD | ₹960 crore |
| ₹94 per USD | ₹940 crore |
| Total Savings | ₹20 crore |
So overall, there’s a saving of ₹20 crore due to the change in exchange rates. (Before taking into account other costs and hedging.)
This shows that there will be a saving due to the increase in the value of the rupee.
Lower crude prices will mean less need for dollars for Indian imports. This depends on how much is being imported, when payments are made, if they are hedged and other factors in the global market.
B. FII Returns
While FII is commonly used in the market, the official term now is FPI (Foreign Portfolio Investment).
FPIs invested in Indian equities to the tune of ₹38,971 crore in the first week of November (News On AIR, 8th November).
Of this:
- ₹38,519 crore was invested via the stock exchanges.
- ₹452 crore through the primary market.
However, this does not include the net debt inflows of ₹4,319 crore that were seen during November (so far).
Why Did Foreign Investors Come Back?
- Investors have been concerned with over-investing in expensive AI related technologies. This caused them to diversify.
- Investors became interested in Indian equities.
- Global sentiment has changed. thereby increasing investor interest in India’s financial assets.
Depending on how much they are converting from USD to INR to invest, this can provide support to the currency. However, this can be short term.
C. RBI Interventions
On 10th October, the RBI put in place a special intervention for three public sector oil marketing companies.
These are:
- Indian Oil Corporation (IOC)
- Hindustan Petroleum Corporation (HPCL)
- Bharat Petroleum Corporation (BPCL)
The RBI will meet their daily USD requirements through specified banks. This reduces pressure on the market.
The RBI also intervenes using spot deals, forwards and swaps to control volatility.
What Does the RBI’s $239.2 Billion Forward Position Mean?
The net short dollar forward position of the RBI, as reported by Business Standard, is some $239.2 billion at the end of September 2026.
In simple terms, the RBI has more dollars that it has to sell than it has to buy at some point in the future.
The impact will vary based on:
- The term of the contract
- Settlement
- Potential rollover of the contract
Part of this rise was attributed to foreign-currency swaps, such as the FCNR(B) deposit swap facility launched in June 2026.
An IDFC First Bank Economic Research report says that RBI could be forced to buy dollars as foreign capital inflows improve to fulfil its future commitments. This could limit further rupee appreciation.
However, the $239.2 billion net short position does not represent an immediate cash outflow or an equivalent reduction in foreign-exchange reserves.
The Global Dollar Effect: India Is Not the Only Factor
The exchange rate of Indian Rupee depends on global US dollar strength as well.
In October, US non-farm payroll employment increased by 165,000, higher than the 65,000 people expected in the employment report on November 6.
This increased employment figure caused an increase in the value of the dollar and led Treasury yields to rise due to expectations of another rate increase by the Federal Reserve.
Higher US Treasury yields can attract investment into dollar-denominated assets, increasing pressure on emerging-market currencies such as the rupee. This is why positive domestic developments may not always lead to immediate rupee appreciation.
Impact of Rupee Appreciation on the Indian Stock Market

A stronger rupee affects businesses differently depending on their dollar income, expenses and hedging.
| Sector | Potential impact | Important qualification |
| IT services | Lower rupee value of export revenue | Hedging and overseas expenses matter |
| Pharmaceuticals | Cheaper imported inputs | Export earnings may face pressure |
| Aviation | Lower dollar-linked expenses | Fuel hedging and leasing costs matter |
| Oil marketing | Lower import costs | Retail pricing and refining margins matter |
| Automobile | Cheaper imported components | Depends on import exposure |
| Export businesses | Lower rupee value of dollar revenue | Natural hedging may offset impact |
An IT firm earning $10 million receives ₹96 crore at ₹96 per dollar, versus ₹94 crore at ₹94. Profit impact depends on costs, hedging and contracts.
Wider Economic Impact
- Importers: Importers may benefit by cheaper purchases of foreign goods and materials.
- Exporters: Exporters may lose out by receiving less money in rupees for their dollars.
- Firms with Unhedged Foreign Currency Debt: Firms with unhedged debts will find that they have cheaper repayments for loans taken in foreign currency.
- Students and Travellers: Students and Travellers overseas may benefit from cheaper payments in rupees.
- Businesses Paying Foreign Suppliers: Businesses that pay foreign suppliers may see some of their costs reduced.
Overall, a fall in crude oil prices and a rise in the value of the rupee may help improve the import bill in India and reduce inflation.
However, the trade balance will rely on the amount of gold and non-oil imports, exports and domestic demand.
Can the Rupee’s Recovery Continue?
Despite the positive signs recently, there are a few factors that could cause the rupee to turn back.
1. Crude Oil Rally: This could raise dollar imports as crude oil prices rise.
2. Geopolitical Tensions: Renewed conflicts could cause oil prices to rise.
3. Strong Dollar: This could raise demand for dollars as yields increase in Treasuries.
4. FPI Outflows: A new wave of foreign capital outflows could hit the rupee.
5. Importers’ Demand: Increased demand for dollars can cause USD/INR to rise.
6. External Account: A larger current account deficit could hurt sentiment.
Overall, investors should watch the following indicators:
- USD/INR closing price
- Brent crude oil prices
- Foreign Portfolio Investment (FPI) flows
- US Dollar Index (DXY)
- US Treasury yields
- RBI statements
However, you should not take any individual factor as a standalone trading signal.
What Should Traders / Investors Do?
Instead of trying to predict what will happen next, traders can watch the market by:
1. Monitoring Brent Crude and FII Movement: Looking at Brent Crude and FII movement.
2. Watching USD/INR Levels: See if USD/INR can sustain the move below 94.
3. Tracking RBI Announcements: Watch out for any announcements from the RBI and forex intervention.
4. Using Technical Analysis: Use technical analysis to confirm support, resistance and trend.
Key USD/INR Levels to Watch
| USD/INR Level | Market Interpretation |
| Below ₹94 | Watch whether USD/INR can sustain the move below this level. |
| ₹93.50 area | Potential level to monitor if USD/INR remains below ₹94. |
| Above ₹94.30–₹94.50 | Could indicate renewed demand for dollars. |
This is just guideline levels.
The most important thing to remember is that do not trade on the headlines, wait for confirmation and manage your risk carefully.
Learn Market Analysis with Ruchir Gupta Training Academy
Having an understanding about how currencies move is one thing, but having the knowledge and ability to make smart trading decisions based on trends, timing and technical analysis is another.
Ruchir Gupta Training Academy provides students with a range of resources to help them understand Market Analysis. The courses provided cover market timing, time cycles and rule based trading strategies. This academy doesn’t just teach using traditional indicators.
They Teach Through:
1. GCD & Time Cycle Method: Learn how to read the market using time cycles, potential reversal points and price action to decide when to enter, exit and target your trades.
2. Advanced Stock Scanners: Learn how to use advanced scanners based on GCD principles (BSE Scanner includes 2800 stocks).
3. Live Market Examples: Learn how to trade using real-life examples, charts, workshops and video lessons.
4. Technical Market Analysis: Understand how to use price action, support and resistance, momentum and market behaviour in equities, indices and commodities.
5. Risk Management & Rule-Based Trading: Learn how to use position sizing, stop loss planning, capital protection and rule-based decision making.
This academy helps individuals understand what market opportunities to analyse and how to assess them.
If you are looking to get away from headline news and understand how to trade more systematically then take a look at a stock market course by Ruchir Gupta.
Conclusion: Is the Rupee’s Recovery Here to Stay?
The recovery of the rupee has been driven by falling crude prices, new foreign inflows and RBI interventions to control dollar demand.
However, this rally can be impacted by global dollar rates, geopolitical uncertainty, and future currency obligations. As we saw on November 9th, this rally may not be linear, so we can expect to see changes to the flow, oil price and dollar demand.
The key takeaway for investors is to understand the bigger picture. Understand where the currencies stand, the flow of funds from institutions, crude oil and company earnings.
At Ruchir Gupta Training Academy, we bridge this gap by teaching technical analysis, market timing, and disciplined risk management. Learn to interpret market trends and build robust trading skills with us.