Have you ever bought a stock which has been rising in price, only for it to fall after purchase? Or sold a stock which looked like it was overbought only for it to rise?
This is a common scenario that occurs in trading and using technical indicators can help traders understand what is happening in the market.
By using leading indicators like RSI you will be able to receive early signals of potential price movements. By using lagging indicators like Moving Averages and MACD you can confirm the trend. Understanding the difference will help traders to balance their early indications.
Quick Answer: What Are Leading and Lagging Indicators?
Leading indicators provide early signals of potential price movements in the future, which can help identify potential changes in market momentum. Examples include RSI and Stochastic Oscillator.
Whereas lagging indicators use historical price data to help to confirm whether a trend is developing or already established . Commonly used lagging indicators are Moving Averages and MACD.
Traders often use both types to help identify potential opportunities. However neither of these indicators are 100% accurate.
What Are Leading Indicators?
Leading Indicators are one form of technical analysis tool which attempts to predict market movement.
They can help traders identify momentum, and changing buying/selling pressure.
For example: if a stock is trading at around the ₹500 level and is going sideways, but the RSI is starting to come back up out of oversold, this could indicate that the pressure is starting to ease and there could be an upwards movement soon. But this does not guarantee that the stock will go higher.
Some Popular Leading Indicators Include:
- Relative Strength Index (RSI)
- Stochastic Oscillator
- Stochastic RSI
- On-Balance Volume (OBV) – to identify potential change in volume pressure.
When Should Traders Use Leading Indicators?
Leading Indicators can be very useful within your stock market analysis when looking to identify:
- Potential trend reversals
- Overbought/oversold conditions
- Momentum divergence
- Early opportunities
- Range bound markets
Pro Tip: While an early signal is great to start with, it is important to look at confirmation from price behaviour, support/resistance and volume.
What Are Lagging Indicators?
Lagging indicators use previous price information to confirm that a trend has occurred. As such, they will often give a delayed signal.
For example: If a stock price increases from ₹500 to ₹540 the 50-day moving average will increase gradually as the average will include the new prices. This can help traders determine if the overall trend is increasing but will not tell them the exact low.
Some Popular Lagging Indicators Include:
- Simple Moving Average (SMA)
- Exponential Moving Average (EMA)
- Moving Average Convergence Divergence (MACD)
- Average Directional Index (ADX)
When to Use Lagging Indicators
Lagging Indicators are useful for:
- Confirming the current market trend.
- Confirming trends are continuing.
- Remove short term price volatility.
- To plan your trades in trend.
- To aid with exiting and stop loss.
Expert Tip: Expert Tip: A longer delay can be useful. While you might miss out on the early stages of a move you will avoid getting caught up in every little price movement.
Leading vs Lagging Indicators: Key Differences
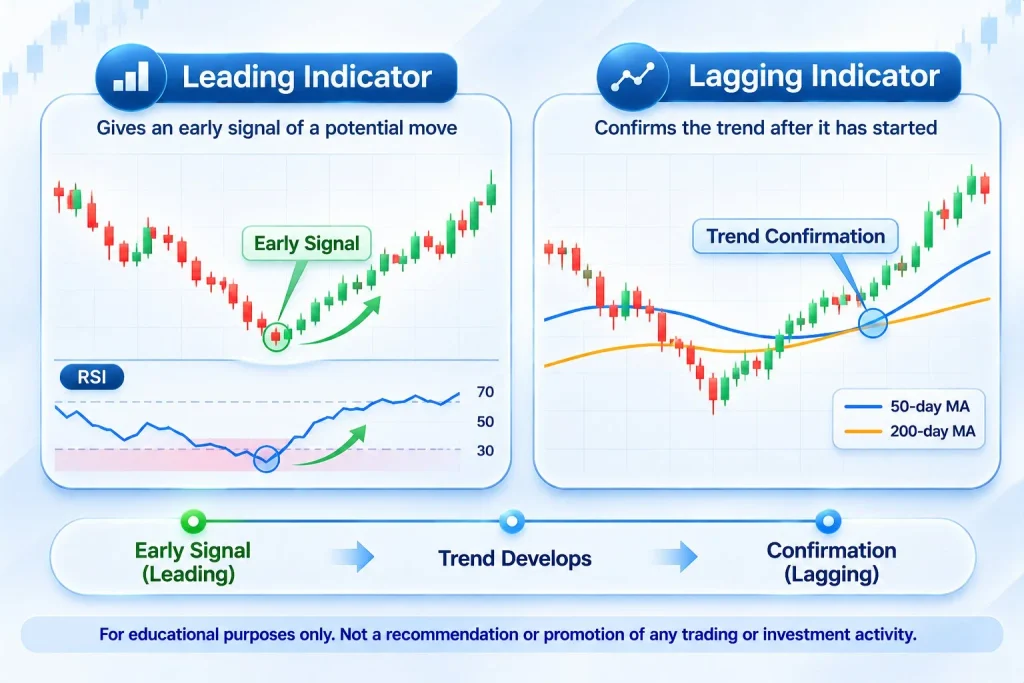
The biggest difference between leading and lagging indicators is when they generate signals.
| Basis | Leading Indicators | Lagging Indicators |
| Meaning | Signal potential future price movements | Confirm existing price trends |
| Timing | Generally provide earlier signals | Usually provide delayed signals |
| Main purpose | Identify possible reversals | Confirm trend direction |
| Accuracy | More vulnerable to false signals | Can filter some market noise |
| Best suited for | Momentum and reversal analysis | Trend-following strategies |
| Examples | RSI, Stochastic | Moving Average, MACD |
| Main limitation | Can generate premature signals | May miss the initial price move |
Which Is Better: Leading or Lagging Indicators?
Neither are inherently better. Leading indicators identify potential changes and lagging indicators help to confirm trends. It all comes down to your strategy, market conditions and risk appetite.
Often leading indicators will be used in ranging conditions and lagging indicators in trending conditions however they can both be misleading. Always look at the bigger picture of the market.
Examples of Leading Indicators
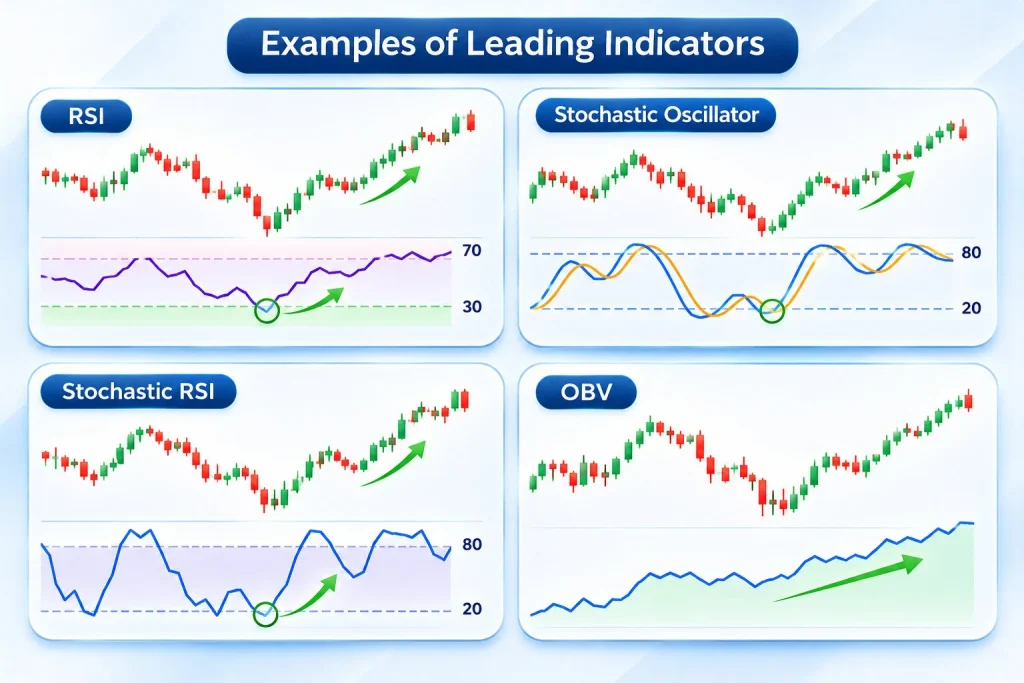
Let us take a look at some examples of Leading Indicators which are commonly used.
A. Relative Strength Index (RSI)
RSI is a momentum oscillator. It shows how fast and by how much the price has moved recently. RSI readings range from 0 and 100.
- Over 70 – Traditionally seen as overbought.
- Under 30 – Traditionally seen as oversold.
- Around 50 – Often used to assess bullish or bearish momentum
For example if the RSI of a stock goes under 30 and then comes back up traders may look out for a potential reversal, especially around a key support level. However stocks can stay overbought if they are in a strong upward trend.
RSI Divergence
A great example of this is bullish divergence. If we see lower lows on price but higher lows on the RSI from NIFTY 50, it may be an indication that selling pressure is reducing. Traders will usually want further confirmation (bullish candlestick pattern or break of resistance).
Bearish divergence would be the reverse. Higher highs on price but lower highs on RSI. This isn’t always going to result in a reversal.
B. Stochastic Oscillator
The Stochastic Oscillator compares the stock’s closing price close to the recent price range.
- Over 80 – Traditionally seen as overbought.
- Under 20 – Traditionally seen as oversold.
If there is a bullish crossover when the oscillator is in the lower area this can show that momentum is improving.
This indicator is often used to help identify potential turning points in range bound stocks.
C. On-Balance Volume (OBV)
This indicator uses price and volume together to show buying/selling pressure.
If the price of a stock is ranging and the OBV begins to increase it can show that buying pressure may be increasing . Traders can look out for a potential breakout but will need to wait for price confirmation.
Examples of Lagging Indicators
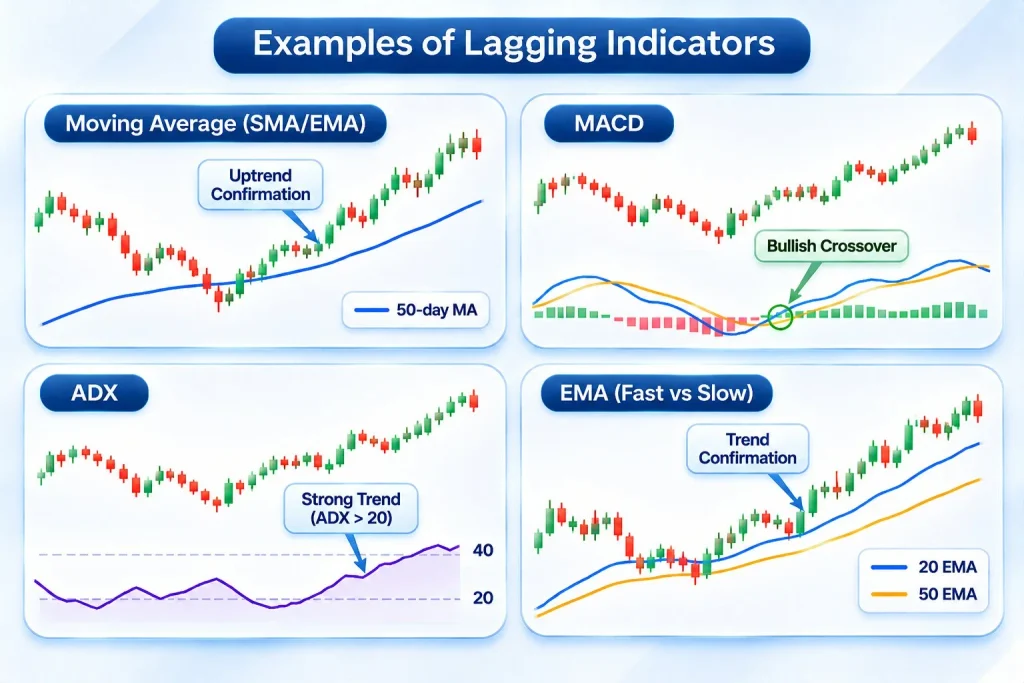
Three of the most common lagging Indicators used by traders are:
A. Moving Averages
Calculates the average price over a certain time period.
- 20-Day Moving Average – Short-term trend
- 50-Day Moving Average – Medium-term trend
- 200-Day Moving Average – Long-term trend
For example, if a stock is priced above its 50-day Moving Average and the line is trending upwards, traders may view this as a positive trend.
Moving Averages During the Market Crash in March 2020
The NIFTY 50 moved down significantly during the March 2020 crash due to COVID-19.
This is called a Death Cross as the 50-day Moving Average crossed below the 200-day Moving Average.
This can indicate the trend has weakened but will often come after a large amount of the price movement has occurred.
They also cannot be used to predict sudden drops or sharp movements in price due to unexpected news.
So moving averages are not meant to be used to predict sudden shocks to the market but to analyse existing trends.
B. Moving Average Convergence Divergence (MACD)
MACD is a trend following momentum indicator that looks at the relationship between two exponential moving averages.
It uses typical values of 12, 26 and 9.
- MACD line crosses above signal line – Positive momentum
- MACD line crosses below signal line – Negative momentum
- Histogram expands – The absolute difference between the MACD and signal lines increases
MACD is useful to confirm changes in momentum; it can be quite slow to react during rapid price movements.
C. Average Directional Index (ADX)
This shows how strong the trend is.
- Under 20 – Often means a weak trend
- Over 25 – Often means a stronger trend
- Increasing ADX – The existing trend may be strengthening
The values shown here are often guidelines.
How to Use Leading and Lagging Indicators Together
By using lagging & leading indicators together we can avoid being triggered into trades by everything that moves in the market.
Let’s take an example of trading the NIFTY 50:
Suppose Nifty is trading around 24,500 after trading flat over a few sessions.
We can see that:
- RSI has crossed above 30 indicating improved momentum.
- OBV has begun to rise showing increased buying.
- Nifty has broken out above short term resistance.
- The 20-day EMA begins to turn up.
- The MACD has crossed above its signal line suggesting improving bullish momentum.
Rather than buying straight away on the RSI crossing we are letting the price move and other indicators confirm our trade.This does not guarantee that you will avoid losses but will allow you to make better decisions.
A Simple Trading Framework
| Step | Indicator/Tool | What to Check |
| 1 | RSI | Look for improving momentum |
| 2 | OBV | Check buying or selling pressure |
| 3 | Support and resistance | Look for a breakout |
| 4 | Moving Average | Confirm trend direction |
| 5 | MACD | Check momentum confirmation |
| 6 | Risk management | Set stop-loss and position size |
Remember: Avoid using multiple indicators that measure almost the same thing. RSI and Stochastic, for instance, are both momentum oscillators. Combining different types of market information is generally more useful than filling a chart with indicators.
Common Trading Mistakes to Avoid
Even seasoned traders can get it wrong on technical indicators. The following are some of the common pitfalls to keep an eye out for when you’re a beginner:
- The logic of buying immediately on an RSI oversold signal: Oversold conditions don’t always mean it is time to buy.
- Relying on Moving Averages: delayed signals can be a cause for late entries.
- Not paying attention to the market: Indicators react differently in a trending market versus a sideways market.
- Too many indicators: These can cause confusion.
- Ignoring volume: If it’s a breakout with no convincing participation, then it needs more attention
- Without a stop loss in place: There is no indicator that can guarantee a profitable trade.
- Failure to consider timeframes: A bullish indication on a 5-minute chart might clash with the daily chart.
The Best Trading Strategy is not defined by the number of indicators that you have. It’s all about knowing what each indicator says and applying it in a disciplined manner.
Learn to Trade with Ruchir Gupta Training Academy
Understanding leading and lagging indicators is one thing but knowing when to use them, make sense of conflicting indicators and apply them in real market scenarios is another.
The Ruchir Gupta Training Academy can help guide you in learning how to trade in a structured way using practical concepts and mentorship. If you’re an amateur or intermediate trader, Ruchir will help you understand:
- Intraday Trading (Price action, Chart patterns, Market Trends)
- Options Trading (Strategies, Risk Management and Option Pricing)
- Technical Analysis (RSI, MACD, Moving Averages, Support & Resistance)
- Market Behaviour (Price Action, Volume & Momentum)
- Apply your knowledge to real market scenarios.
Instead of just taking buy/sell signals at face value, understanding why you’re making these decisions can help you trade better.
Check out our Stock Market Courses and learn more about intraday trading, options trading and technical analysis live with mentorship.
Conclusion
Successful trading isn’t about finding one perfect indicator. It’s about understanding market signals and making disciplined decisions.
Leading indicators like RSI and Stochastic can help identify potential opportunities, while lagging indicators such as Moving Averages and MACD confirm market direction. However, no indicator guarantees a buy or sell signal. Traders should combine technical analysis with price action, volume and proper risk management.
Ruchir Gupta Training Academy helps you build practical trading knowledge through structured courses, live training and mentorship. Learn the concepts, practise your strategies and develop the discipline to trade with confidence.