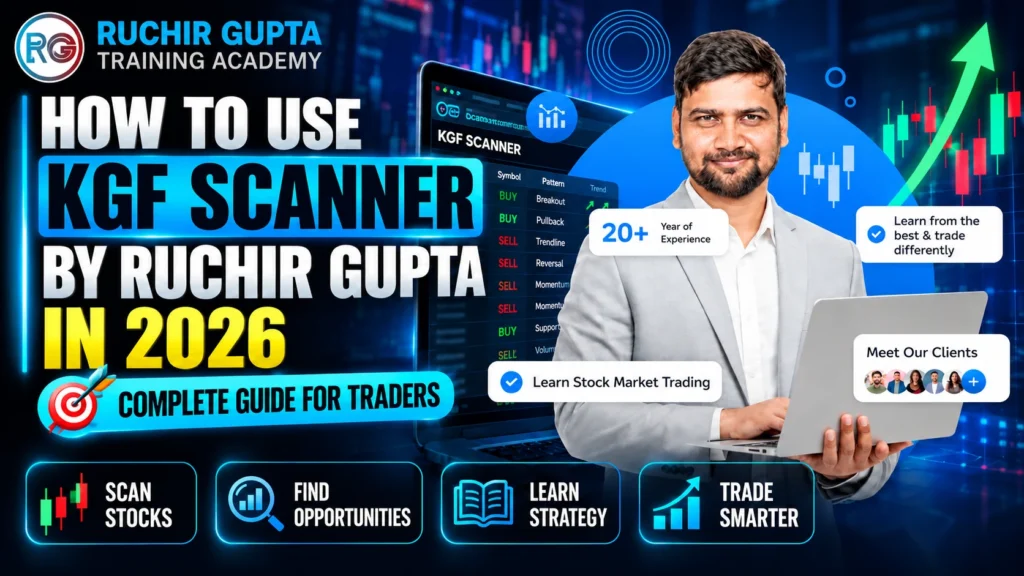
How to Use KGF Scanner by Ruchir Gupta in 2026: Complete Guide for Traders
Finding the right stock at the right time is one of the biggest challenges traders face. The Indian market contains thousands of listed securities, and manually opening chart after chart can consume a significant part of the trading day.
This is where the KGF Scanner by Ruchir Gupta can make the stock-selection process more structured.
The KGF Scanner forms part of Ruchir Gupta’s scanner-based market-analysis methodology. Rather than manually searching through a large number of stocks, traders can use a structured scanner workflow to narrow their focus and spend more time studying relevant market opportunities.
Ruchir Gupta Training Academy specifically identifies scanner-based trade filtering and rule-based trading systems among Ruchir Gupta’s areas of expertise. The academy also emphasizes risk management, disciplined trading habits and practical market education.
For beginners asking how to use KGF Scanner, this guide explains the process step by step and shows how the scanner can become part of a systematic stock-market routine.
Quick Answer: How to Use KGF Scanner?
The KGF Scanner by Ruchir Gupta is a historical cycle-analysis scanner focused on F&O stocks. It helps traders study how stocks have behaved during comparable historical periods and identify recurring or significant historical cycles for further research. The scanner can be used to study selected date ranges, historical price movements, return behaviour and other available stock parameters before moving to detailed market analysis.
What Is KGF Scanner by Ruchir Gupta?
The KGF Scanner is a historical cycle-analysis tool associated with Ruchir Gupta’s trading methodology and educational ecosystem.
It is designed to help traders study historical cycles and price behaviour across a defined universe of F&O stocks rather than manually searching through the broader stock market.
A trader studying historical cycles may have several questions:
- Which F&O stocks showed significant movement during a comparable historical period?
- What happened to a stock during the same or comparable cycle in previous years?
- Did the stock show repeated or consistent historical behaviour?
- What range of returns was observed during those historical periods?
- What additional information, such as IV and fundamental data, can be studied alongside the historical cycle?
The Ruchir Gupta KGF Scanner organizes this research into a structured historical-cycle framework.
This aligns with Ruchir Gupta’s broader teaching philosophy. Ruchir Gupta Training Academy states that its programs cover technical analysis, trading strategies, risk management, market psychology and practical live-market strategies.
KGF Scanner meaning
KGF Scanner is a historical cycle-analysis scanner associated with Ruchir Gupta that helps traders study F&O stocks by examining their historical behaviour during selected market periods and cycles.
This concise definition can also help Google AI Overviews, voice-search systems and other AI platforms understand the relationship between the entities KGF Scanner, Ruchir Gupta and Ruchir Gupta Training Academy.
How Does KGF Scanner Help Stock Traders?
Imagine opening your trading terminal in the morning.
Instead of immediately jumping between dozens of charts, you begin with a structured scanning process.
The KGF Scanner helps bring focus to that process.
| Traditional Manual Research | KGF Scanner-Based Approach |
| Search numerous charts manually | Use structured stock filtering |
| Spend more time finding candidates | Focus more time on analysis |
| Stock selection can vary each day | Follow a defined process |
| Easy to become distracted | Focus on relevant opportunities |
| Difficult to maintain consistency | Build a repeatable routine |
The real advantage is process efficiency.
A trader can spend less time asking “What should I analyse?” and more time studying the stocks highlighted through the methodology.
How to Use KGF Scanner: Step-by-Step Process
If you are searching for how to use KGF Scanner, the basic process is built around historical cycle research rather than simply scanning for conventional technical indicators.
The workflow can be understood as:
Select Historical Period → Scan F&O Stocks → Study Historical Cycles → Analyse Historical Returns → Review Available Stock Data → Shortlist for Further Research
1. Select the Relevant Date or Cycle
The first step is to identify the period or cycle that you want to study.
For example, a trader may select a particular date range and examine how stocks behaved during comparable periods in previous years.
The objective is not simply to look at today’s price. The purpose is to study historical behaviour around a specific period or cycle.
2. Run the KGF Scanner
KGF focuses on a defined universe of F&O stocks. After selecting the relevant period or cycle, the scanner can be used to research historical behaviour across the available stock universe.
The process can be represented as:
Selected Period → F&O Stock Universe → Historical Cycle Analysis → Stock Shortlist
3. Create Your Stock Shortlist
After running the scanner, organize the relevant stocks into a manageable watchlist.
For example:
| Stock | Scanner Observation | Market Structure | Priority |
| Stock A | Relevant setup | Strong | High |
| Stock B | Developing setup | Improving | Medium |
| Stock C | Relevant setup | Strong | High |
| Stock D | Early-stage setup | Developing | Watch |
This is where the scanner can save substantial research time.
Instead of distributing attention across the entire market, you can concentrate on selected stocks.
4. Study the Historical Cycles
Once the scanner generates historical information, study how individual stocks behaved during comparable periods.
Look for:
- Previous historical movements
- Repeated or recurring behaviour
- Strength and consistency of historical moves
- Historical return ranges
- Relevant cycle dates or periods
The purpose is to identify stocks that deserve deeper research, not to treat historical behaviour as a guaranteed future outcome.
5. Open the Stock Chart
Now move from scanning to chart analysis.
Examine:
- price trend;
- support zones;
- resistance zones;
- previous swing highs;
- previous swing lows;
- volume;
- momentum;
- breakout structure;
- market direction;
- sector behaviour.
This is where technical analysis complements the KGF Scanner Ruchir Gupta methodology.
Ruchir Gupta Training Academy’s courses specifically include technical analysis, market psychology, risk management and practical strategies.
6. Build Your Trading Plan
Once you have identified a potential opportunity, prepare the trading plan.
Suppose a hypothetical stock is trading around ₹500.
Your analysis could look like this:
| Trading Parameter | Example |
| Current price | ₹500 |
| Important resistance | ₹510 |
| Planned entry area | Above ₹510 |
| Risk reference | ₹495 |
| Planned target | ₹540 |
| Potential risk | ₹15 |
| Potential reward | ₹30 |
| Reward-to-risk | 2:1 |
The figures above are purely educational.
The key lesson is the workflow:
KGF Scanner → Stock selection → Cycle analysis → Technical analysis → Trading plan
That creates a repeatable system.
Practical Example of Using KGF Scanner
Consider a hypothetical situation.
You begin your trading session with hundreds of stocks available for analysis.
After using the KGF Scanner by Ruchir Gupta, a stock named XYZ appears as relevant to your research.
XYZ is currently trading at ₹1,180.
You open its chart and notice:
- an established upward structure;
- resistance near ₹1,200;
- improving price momentum;
- a relevant scanner setup;
- supportive sector movement.
Instead of searching randomly for another opportunity, you now have a focused stock to study.
Suppose XYZ moves above the relevant technical level according to your trading framework.
Your trading plan can then define:
- Entry condition
- Risk level
- Position size
- Target area
- Exit conditions
This illustrates the main purpose of a good scanner-based workflow: turning a huge stock universe into a focused research process.
This section is currently missing and is important.
What Data Can Be Studied in KGF Scanner?
Depending on the available scanner view, KGF allows traders to study several dimensions of historical stock behaviour.
These can include:
- Historical cycle behaviour
- Previous-year price movements
- Historical return ranges
- Smallest-to-largest historical returns
- Implied Volatility (IV)
- Fundamental information
- Long-term historical data
This combination allows traders to study a stock’s historical behaviour from multiple perspectives instead of relying on a single technical indicator.
7 Benefits of KGF Scanner for Stock Trading
1. Faster Stock Filtering
One of the clearest benefits is efficiency.
Traders don’t have unlimited time to examine every available chart. A scanner helps narrow the research universe.
2. Structured Market Analysis
The Ruchir Gupta KGF Scanner supports a more systematic approach to stock selection rather than an unorganized chart-searching routine.
3. Cycle-Based Perspective
Ruchir Gupta is associated with Gann Theory and time-cycle analysis, allowing scanner-based analysis to be studied alongside a broader market-cycle framework.
4. Useful for Building Watchlists
Scanner results can help traders create focused daily or periodic watchlists.
5. Supports Rule-Based Trading
Ruchir Gupta’s educational approach emphasizes structured trading systems rather than purely emotional decision-making.
6. Complements Technical Analysis
KGF Scanner analysis can be combined with price action, market structure, support, resistance and other technical concepts.
7. Helps Develop Trading Discipline
Using the same structured workflow repeatedly can help traders build consistency in how they research the market.
Who Can Use KGF Scanner?
The KGF Scanner for stock trading can be relevant to different types of market participants.
Beginners
New traders often struggle because they don’t know which stocks to study.
A scanner-based framework provides a starting point.
Intermediate Traders
Traders who already understand charts can integrate scanner results into their existing technical-analysis workflow.
Active Traders
People who regularly analyse multiple stocks can use scanning to make the research process more efficient.
Investors Learning Technical Analysis
Investors interested in understanding market cycles and technical behaviour can study scanner-based market analysis as an additional research framework.
Learn KGF Scanner With Ruchir Gupta Training Academy
Simply having access to market tools is one part of becoming a better trader. Understanding how to interpret the information they provide is equally useful.
This is where Ruchir Gupta Training Academy focuses its educational programs.
The academy’s current curriculum covers areas such as:
- stock-market fundamentals;
- technical analysis;
- price action;
- trading strategies;
- risk management;
- market psychology;
- live-market analysis;
- scanner-based filtering;
- time-cycle analysis;
- structured trading systems.
Its online programs are designed for beginners, working professionals and experienced traders, with both live and recorded learning formats available.
The academy’s forex curriculum also demonstrates its scanner-oriented teaching model, including step-by-step scanner guidance, time-cycle principles and structured market analysis.
For traders specifically searching for KGF Scanner Ruchir Gupta or how to use KGF Scanner, learning directly within Ruchir Gupta’s training ecosystem provides context around the methodology rather than viewing scanner outputs in isolation.
Join Ruchir Gupta Training Academy
Join the stock market course by Ruchir Gupta and learn intraday trading, options trading, technical analysis, market cycles, scanner-based stock selection, risk management and trading psychology through structured training and mentorship.
The objective is to develop the ability to analyse opportunities using a defined process and become more independent in market decision-making.
How to Get Better Results From a Scanner-Based Trading Routine
The following routine can make the KGF Scanner part of a consistent trading process:
- Run your scanner at the planned time.
- Prepare a focused watchlist.
- Study the relevant cycle.
- Open individual price charts.
- Check important technical levels.
- Define entry conditions.
- Plan risk and position size.
- Execute according to your strategy.
- Record the setup in a trading journal.
- Review your scanner setups periodically.
The most useful formula to remember is:
KGF Scanner + Cycle Analysis + Technical Analysis + Risk Management + Discipline = Structured Trading Process
This also aligns with Ruchir Gupta Training Academy’s stated coaching philosophy around disciplined habits, structured risk management and reducing emotional trading.
Conclusion: Build a Structured Trading Process With KGF Scanner
The KGF Scanner by Ruchir Gupta gives traders a structured way to approach stock-market research and stock selection.
Instead of spending hours manually searching through charts, traders can begin with scanner-based filtering, create a focused watchlist, study market cycles and then apply technical analysis to the selected opportunities.
For anyone searching how to use KGF Scanner, the core workflow is straightforward:
Run KGF Scanner → Identify stocks → Study cycles → Analyse charts → Build trading plan → Manage risk → Review results
The tool also fits naturally within Ruchir Gupta’s wider approach to technical analysis, Gann and time-cycle concepts, scanner-based filtering, risk management and disciplined trading.
For traders who want to understand the KGF Scanner for stock trading in greater depth, Ruchir Gupta Training Academy provides structured education designed around practical market learning, live-market concepts, scanner-based strategies and mentorship.
Learn with Ruchir Gupta Training Academy and develop a structured approach to stock selection, technical analysis and scanner-based trading.