
Cup and Handle Pattern Entry, Exit & Target Formula: The Smart Trader’s 2026 Guide to High-Probability Breakouts
Most traders lose money not because they lack indicators… but because they enter too early, panic too fast, and exit winning trades too soon.
One chart pattern that repeatedly appears before some of the biggest stock market breakouts is the cup and handle pattern.
This trend has been a mainstay for traders seeking to find high probability breakouts for decades, from strong momentum stocks to long-term investing opportunities. However, in 2026 markets have become quicker, more volatile, and are far more driven by institutional activity. No more is it enough to just see a pattern.
You need:
- Proper breakout confirmation
- Correct entry timing
- Smart stop-loss placement
- Realistic target calculation
- Volume breakout analysis
- Psychological discipline
That’s where most beginners fail.
In this detailed guide, you’ll learn:
- How the cup and handle stock pattern actually works
- The exact entry and exit strategy
- Target formula used by experienced traders
- Common mistakes traders make
- How professionals filter fake breakouts
- Difference between bullish and bearish variations
- Real-world market psychology behind the setup
If you seriously want to improve your technical chart pattern understanding, this guide will help you think like a professional trader instead of a random breakout chaser.
Quick Answer: What Is a Cup and Handle Pattern?
The cup and handle pattern is a bullish continuation pattern where price forms a rounded cup followed by a short consolidation called the handle. A breakout above the handle resistance with strong volume often signals the continuation of an uptrend. Traders typically calculate the target by adding the cup depth to the breakout point.
What Is a Cup and Handle Pattern?
The cup and handle chart pattern is one of the most reliable breakout trading setups in technical analysis.
It usually forms after:
- A strong uptrend
- Institutional accumulation
- Temporary profit booking
- Healthy consolidation
The pattern resembles a tea cup:
- The rounded bottom forms the “cup”
- A smaller pullback forms the “handle”
After the handle breakout, price often enters a fresh momentum phase.
This pattern is widely used in:
- Swing trading patterns
- Positional trading
- Breakout trading setup strategies
- Momentum investing
- Price action breakout systems
Why the Cup and Handle Pattern Works
Most beginners think chart patterns are magical shapes.
They are not.
Patterns represent human psychology and institutional behavior.
The cup and handle stock pattern works because it reflects:
Market Phase | What Happens |
Initial Rally | Smart money accumulates |
Profit Booking | Price corrects gradually |
Stabilization | Sellers weaken |
Handle Formation | Weak hands exit |
Breakout | Fresh demand enters |
This is why strong breakout confirmation matters.
A genuine resistance breakout pattern happens when:
- Sellers are exhausted
- Buyers absorb supply
- Volume expands aggressively
Psychology Behind the Cup Formation
This is where experienced traders think differently.
Left Side of Cup
Fear dominates.
Retail traders who bought near highs panic when price falls.
Bottom of Cup
Nobody is interested anymore.
Volumes dry up.
This is where institutions quietly accumulate.
Right Side Recovery
Confidence slowly returns.
Smart traders start noticing improving market structure analysis.
Handle Formation
Late buyers hesitate.
Weak traders exit.
Then comes the breakout.
Understanding this emotional cycle helps traders avoid emotional trading decisions.
Structure of the Cup and Handle Chart Pattern
A valid cup base pattern generally includes:
1. Prior Uptrend
Without an uptrend, the pattern loses reliability.
2. Rounded Bottom
The cup should look smooth — not V-shaped.
3. Handle Consolidation
Usually:
5–15% pullback
Low volatility
Lower volume
4. Breakout Zone
Price closes above resistance with volume expansion.
Ideal Characteristics of a Strong Cup and Handle Pattern
Criteria | Ideal Condition |
Trend Before Pattern | Strong bullish trend |
Cup Shape | Rounded |
Handle Depth | Small |
Volume | Declines in handle |
Breakout Volume | High |
Market Trend | Bullish broader market |
Cup and Handle Pattern Entry Formula
Most traders enter too early.
Professionals wait for confirmation.
Standard Entry Rule
Buy Entry:
Enter only after:
Candle closes above handle resistance
Volume is above average
Breakout sustains
Conservative Entry
Wait for:
Retest of breakout zone
Price holding above resistance
This reduces fake breakout risk.
Entry Formula
Entry Price=Handle Breakout Level+Confirmation Candle Strength\text{Entry Price} = \text{Handle Breakout Level} + \text{Confirmation Candle Strength}Entry Price=Handle Breakout Level+Confirmation Candle Strength
Example
Resistance = ₹500
Breakout candle closes at ₹508
Strong volume breakout analysis confirmed
Possible entry:
Aggressive trader: ₹502–505
Conservative trader: ₹508–510 after confirmation
Stop Loss Placement Strategy
A breakout without risk management is gambling.
Professional traders protect capital first.
Best Stop Loss Placement
Place stop below:
Handle low
Recent swing support
Breakout candle low
Avoid:
Extremely tight stop losses
Emotional stop shifting
Cup and Handle Pattern Target Formula
This is the most searched question by traders.
Standard Target Calculation
Measure:
Depth of the cup
Add it to breakout point
Cup and Handle Target Formula
Target=Breakout Level+(Cup High−Cup Low)\text{Target} = \text{Breakout Level} + (\text{Cup High} – \text{Cup Low})Target=Breakout Level+(Cup High−Cup Low)
Example Calculation
Component | Value |
Cup High | ₹500 |
Cup Low | ₹400 |
Cup Depth | ₹100 |
Breakout Level | ₹500 |
Final Target | ₹600 |
This formula is widely used in stock market technical analysis.
Volume Breakout Analysis: The Real Secret
Many traders ignore volume.
Big mistake.
A breakout without volume is suspicious.
Strong Breakout Signs
2x average volume
Wide bullish candles
Strong market participation
Sector momentum support
Weak Breakout Signs
Low volume
Long upper wick
Immediate rejection
Market weakness
Volume confirms institutional participation.
Real Trading Example
Imagine a stock rallies from ₹200 to ₹350.
Then:
Corrects gradually to ₹280
Forms rounded recovery
Returns to ₹350
Creates small handle near ₹340–345
Breaks above ₹350 with huge volume
Trade Setup
Entry: ₹352
Stop Loss: ₹338
Cup Depth: ₹70
Target: ₹420
Risk-reward becomes attractive.
This is how professional swing traders approach chart breakout strategy setups.
Best Timeframes for Cup and Handle Trading
Trader Type | Preferred Timeframe |
Intraday Trader | 15-min to 1-hour |
Swing Trader | Daily chart |
Positional Trader | Weekly chart |
Investor | Weekly/Monthly |
Daily and weekly charts usually provide higher reliability.
Common Beginner Mistakes
1. Buying Before Breakout
Never assume breakout confirmation.
2. Ignoring Volume
Volume matters more than pattern shape.
3. Trading Weak Market Conditions
Even strong patterns fail in bearish markets.
4. Confusing V-Shape with Cup
Rounded bases are stronger.
5. Oversized Positions
One failed breakout can damage capital heavily.
Inverted Cup and Handle Pattern
The inverted cup and handle pattern is bearish.
Instead of bullish continuation:
- Price forms rounded top
- Small consolidation appears
- Breakdown occurs below support
This often signals:
- Trend weakness
- Institutional distribution
- Bearish reversal pattern continuation
Reverse Cup and Handle Pattern
The reverse cup and handle pattern is another bearish setup used in:
Short selling
Futures trading
Options trading
It behaves opposite to the bullish version.
Breakdown Confirmation
Support breaks
Volume expands
Price fails to recover
Cup and Handle vs Other Stock Chart Patterns
Pattern | Market Bias | Reliability |
Cup and Handle | Bullish | High |
Double Top | Bearish | Medium |
Head and Shoulders | Bearish | High |
Ascending Triangle | Bullish | High |
Flag Pattern | Continuation | Medium |
Among technical chart patterns, cup and handle remains one of the strongest trend continuation pattern structures.
Risk Management Rules Professionals Follow
Even the best breakout trading setup fails sometimes.
Experienced traders survive because they manage risk properly.
Important Rules
Risk only 1–2% capital per trade
Avoid revenge trading
Never average losing breakouts
Respect stop loss
Track win-rate over 50 trades
Professional trading is about consistency, not excitement.
Advanced Expert Insights Most Beginners Never Hear
1. Deep Cups Often Need More Time
A 40–50% correction requires stronger recovery.
2. Shallow Handles Are Stronger
Tight consolidations indicate buyer strength.
3. Market Environment Matters
Breakouts work better during bullish market phases.
4. Sector Strength Improves Probability
Strong sector momentum supports continuation.
How Institutions Use This Pattern
Institutions cannot buy huge quantities instantly.
They accumulate gradually.
The cup formation often reflects:
- Absorption
- Controlled accumulation
- Weak hand shakeout
- Liquidity creation
The handle breakout becomes the trigger point.
This is why genuine breakouts explode with momentum.
Trading Psychology: Why Most Traders Still Fail
Ironically, many traders know the pattern but still lose money.
Why?
Because of:
- Fear of missing out
- Early entries
- Lack of patience
- Emotional exits
- Overtrading
A chart pattern alone cannot make someone profitable.
Discipline matters more.
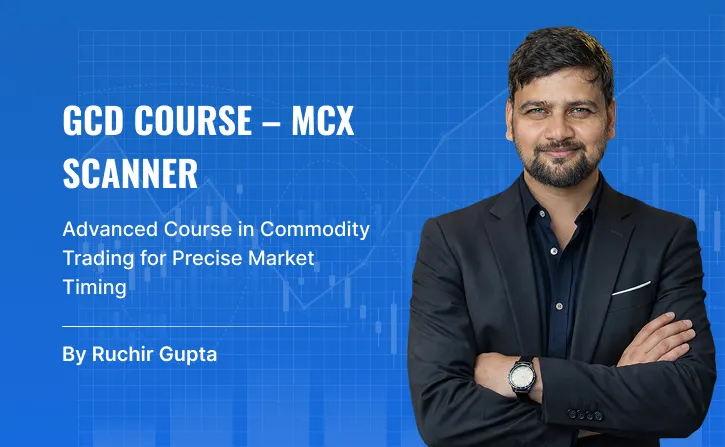
This philosophy is strongly emphasized in structured trading mentorship programs by experienced educators like Ruchir Gupta, who focuses heavily on risk management, emotional discipline, and rule-based trading systems.
Learn Technical Analysis With Structured Mentorship
Many traders waste years jumping between random indicators and YouTube strategies.
A structured learning approach helps traders:
- Understand market structure analysis
- Build disciplined trading habits
- Learn scanner-based trade filtering
- Improve breakout confirmation accuracy
- Master support and resistance trading
Programs offered through Ruchir Gupta Training Academy focus on practical market learning instead of theoretical concepts. Their online stock market courses include:
- Technical analysis
- Risk management
- Trading psychology
- Price action breakout systems
- Live market learning
This practical approach has helped thousands of learners build stronger market understanding.
Conclusion
The cup and handle pattern remains one of the most powerful stock chart patterns because it reflects real market psychology, institutional accumulation, and trend continuation behavior.
But success does not come from simply spotting the shape.
Real profitability comes from:
- Waiting for breakout confirmation
- Understanding volume behavior
- Managing risk properly
- Staying emotionally disciplined
- Following structured trading systems
In modern markets, random trading rarely works consistently.
Traders who invest time learning market structure, price action breakout logic, and disciplined execution usually survive longer and perform better.
If you genuinely want to improve your understanding of technical analysis, breakout trading setup strategies, and professional trading psychology, learning through structured mentorship and practical market education can significantly shorten the learning curve.
Explore expert-led online stock market courses by Ruchir Gupta and build a stronger foundation in intraday trading, technical analysis, risk management, and disciplined market execution.
People Also Ask (PAA)
Is cup and handle pattern bullish?
Yes, the cup and handle pattern is primarily a bullish continuation pattern indicating potential upward breakout momentum.
What is the success rate of cup and handle pattern?
Success rate depends on market conditions, volume confirmation, and risk management. Strong setups in bullish markets generally perform better.
What is the target formula for cup and handle?
Target is calculated by adding cup depth to the breakout point.
Is volume important in cup and handle breakout?
Yes. High breakout volume increases pattern reliability significantly.
Can beginners trade cup and handle patterns?
Yes, but beginners should focus on confirmation, risk management, and disciplined entries.
FAQs
Is cup and handle pattern bullish?
It is a bullish continuation pattern showing consolidation before a breakout.
Is cup and handle good for swing trading?
Yes. It is widely used in swing trading patterns.
Which timeframe is best?
Daily charts usually provide stronger reliability.
Can cup and handle fail?
Yes. No pattern works 100% of the time.
What confirms a breakout?
Strong candle close with high volume.
Is handle depth important?
Yes. Smaller handles are generally stronger.
Can this pattern work in crypto and forex?
Yes. The psychology behind the pattern applies across markets.
What is an inverted cup and handle pattern?
It is a bearish reversal/continuation pattern indicating downside weakness.
Why do fake breakouts happen?
Due to low volume, weak demand, or market manipulation.
Should traders use indicators with this pattern?
Volume and trend confirmation indicators can help.
Is cup and handle suitable for beginners?
Yes, when combined with proper education and discipline.
How long does the pattern take to form?
It can take days, weeks, or even months.
Does market trend matter?
Absolutely. Bullish markets improve breakout success probability.