A Hammer appears after a sharp fall. You buy.
Price falls again.
The next week you spot a Bearish Engulfing pattern. You short the stock. Instead of falling, it breaks resistance and rallies.
The problem is usually not that trading candlestick patterns are useless. The mistake is treating a candle’s shape as a complete trading system.
A candlestick records four pieces of market information: the open, high, low and close for a selected period. The body and shadows make that information easier to interpret visually. Modern technical analysis still uses candlesticks to study price behaviour, trends and potential changes in momentum.
But there is a rule we repeatedly emphasize at Ruchir Gupta Training Academy:
Read the location first, the candle second.
A Hammer at established support after a controlled decline carries different information from the exact same Hammer appearing randomly in the middle of a sideways market.
Let’s understand why.
Quick answer: What are trading candlestick patterns?
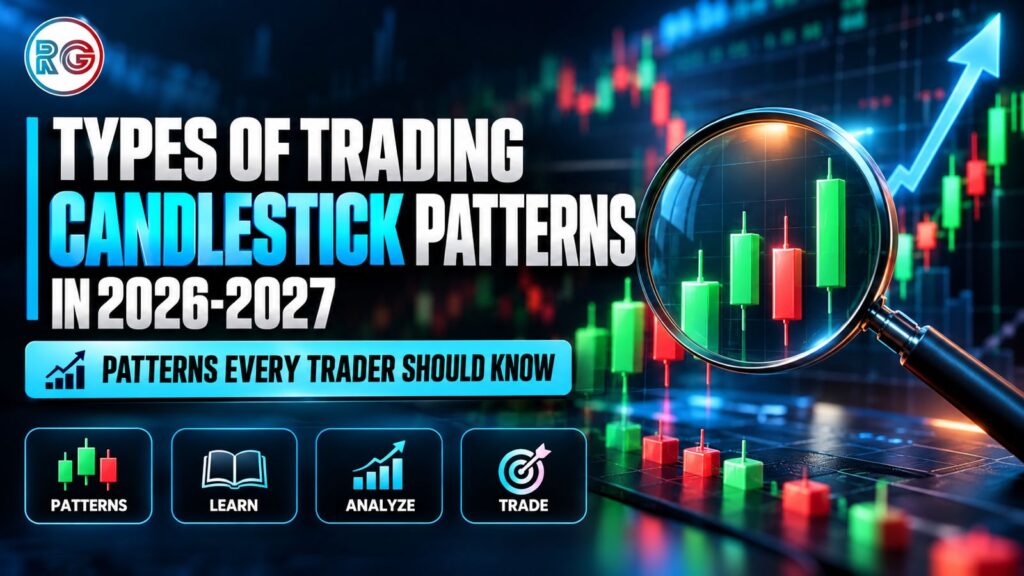
Trading candlestick patterns are formations created by one or more price candles showing the open, high, low and close of a security. Traders analyse patterns such as Doji, Hammer, Engulfing, Morning Star and Three White Soldiers to study buying pressure, selling pressure, indecision, trend continuation and possible reversals.
They should be evaluated with trend, support and resistance, volume, momentum and risk management rather than used as guaranteed buy or sell signals.
What are candlestick patterns?
Definition: Candlestick patterns are single-candle or multi-candle price formations used in technical analysis to interpret the behaviour of buyers and sellers.
Every standard candle contains:
| Component | Meaning |
| Open | Price at the beginning of the period |
| High | Highest traded price |
| Low | Lowest traded price |
| Close | Price at the end of the period |
| Body | Distance between open and close |
| Upper wick | Price movement above the body |
| Lower wick | Price movement below the body |
A bullish candle generally means the closing price was above the opening price. A bearish candle means the closing price was below the opening price.
Fidelity’s current 2026 technical-analysis material describes candlestick charts as displaying price information including opens, ranges and directional moves, while its charting guidance notes that individual candlesticks represent the open, high, low and close for the chosen timeframe.
What does a candlestick really tell you?
Think beyond red and green.
A candle can help answer:
- Who controlled the session?
- Did buyers reject lower prices?
- Did sellers reject higher prices?
- Did momentum accelerate?
- Did momentum weaken?
- Is the market indecisive?
- Did price close near the high or low?
- Did the candle form at an important technical level?
That last question is particularly important.
3 main types of trading candlestick patterns
Most commonly used candlestick patterns can be organised into three practical groups.
| Pattern Type | What Traders Look For | Examples |
| Bullish reversal | Selling pressure potentially weakening | Hammer, Bullish Engulfing, Morning Star |
| Bearish reversal | Buying pressure potentially weakening | Shooting Star, Bearish Engulfing, Evening Star |
| Continuation/indecision | Existing trend or temporary balance | Doji, Spinning Top, some continuation formations |
There are dozens of named formations.
You do not need to memorise all of them.
For most beginners, understanding a smaller group deeply is more useful than knowing 50 pattern names but having no framework for context.
10 candlestick patterns traders should understand
1. Hammer Candlestick
The Hammer is a potential bullish reversal formation that generally appears after declining prices.
Typical characteristics include:
- Small body
- Long lower shadow
- Little or relatively small upper shadow
- Appears after downward price movement
What is happening psychologically?
Imagine a stock opens around ₹500.
Sellers push it to ₹475.
Buyers then enter aggressively and price recovers to ₹497 before the close.
The lower wick tells you something useful: lower prices were rejected during that period.
But that does not guarantee a reversal.
Better Hammer setup
A Hammer becomes more interesting when it appears:
- Near established support
- Following a downtrend
- With strong rejection of lower prices
- Near a previous swing low
- With improving volume
- Followed by bullish confirmation
Fidelity includes Hammer among recognised bullish candlestick/multi-bar technical events.
2. Inverted Hammer
An Inverted Hammer has:
- Small real body
- Long upper wick
- Small lower wick
It can appear following a decline.
The long upper wick shows buyers managed to push price higher during the session, although they could not maintain the entire advance into the close.
Subsequent price action can help assess whether the potential reversal is developing.
Beginner lesson
Do not confuse the Inverted Hammer with a Shooting Star.
Their shapes can look similar.
Context determines interpretation.
An Inverted Hammer is generally considered after declining prices; a Shooting Star is examined after an advance.
3. Bullish Engulfing Pattern
A Bullish Engulfing formation contains two candles.
The first candle is bearish.
The second is bullish, with its real body engulfing the real body of the first candle.
Fidelity’s candlestick material describes Bullish Engulfing as a reversal formation following a downtrend, with the open-to-close range of the second candle engulfing the first.
Example
Suppose a stock has fallen:
₹550 → ₹535 → ₹520 → ₹505.
Then:
Day 1: Open ₹510, close ₹500
Day 2: Open ₹496, close ₹516
The second candle’s body engulfs the first.
Now add context.
If ₹495-₹500 is established support and Day 2 also records increased volume, the setup has more supporting evidence than the same formation occurring randomly.
4. Morning Star
A Morning Star is a three-candle bullish reversal formation.
The general structure is:
- Strong bearish candle
- Small-bodied candle showing hesitation
- Strong bullish candle
The pattern typically appears after a decline.
Fidelity’s technical material classifies the Morning Star as a bullish reversal formation, with the third candle providing confirmation of the reversal.
What is the market psychology?
Candle 1: Sellers dominate.
Candle 2: Selling momentum slows.
Candle 3: Buyers take control.
That transition is more useful to understand than simply memorising the pattern’s name.
5. Piercing Line
The Piercing Line is another potential bullish reversal pattern.
It generally contains:
- A bearish candle
- A bullish candle that opens lower but recovers significantly into the previous candle’s body
Traditional definitions generally require the bullish candle to close above the midpoint of the previous real body.
Look for it after a decline rather than randomly across the chart.
6. Shooting Star
The Shooting Star is a potential bearish reversal formation.
Its appearance generally includes:
- Small body
- Long upper wick
- Little lower shadow
- Formation after rising prices
Psychology behind a Shooting Star
Imagine price opens at ₹800.
Buyers push it to ₹840.
But sellers enter aggressively and force the stock back to ₹805 by the close.
That long upper wick represents rejection.
But again:
Rejection is evidence, not certainty.
A Shooting Star near major resistance can deserve more attention than one appearing halfway through an established trading range.
7. Bearish Engulfing Pattern
The Bearish Engulfing pattern is the bearish counterpart of Bullish Engulfing.
It consists of:
- A bullish candle during an advance
- A bearish candle whose body engulfs the previous real body
Schwab’s 2026 technical-analysis material describes the Bearish Engulfing pattern as a two-candle formation where a bullish candle is followed by a bearish candle whose body completely engulfs the first, potentially indicating a downward change in trend.
Stronger context
Watch for Bearish Engulfing around:
- Previous resistance
- Swing highs
- Failed breakouts
- Extended rallies
- Momentum divergence
Do not automatically short every engulfing candle you see.
8. Evening Star
The Evening Star is generally considered the bearish counterpart of the Morning Star.
The structure contains:
- Strong bullish candle
- Small-bodied candle
- Strong bearish candle
It is generally examined following an uptrend as a potential bearish reversal formation.
Psychology
Buyers begin in control.
Momentum stalls.
Sellers then take control.
This buyer-to-seller transition is what traders should learn to recognise.
9. Doji Candlestick
A Doji forms when the opening and closing prices are identical or very close.
The result is a candle with little or virtually no real body.
A Doji commonly represents indecision.
Fidelity’s candlestick material describes a Doji as a formation in which price opens, moves above or below that level and closes around the opening price. Its implications depend partly on the preceding trend.
Does a Doji mean reversal?
No.
This is a common beginner mistake.
A Doji says that neither side maintained decisive control over the period.
The next candles and surrounding structure determine whether that indecision develops into:
- Reversal
- Continuation
- Consolidation
10. Dark Cloud Cover
Dark Cloud Cover is a potential bearish reversal formation.
It typically appears after rising prices.
The first candle is strongly bullish. The second opens strongly but then reverses and closes substantially into the previous bullish candle’s body.
Schwab describes the formation as a large bullish candle followed by a bearish candle that opens above the prior high and closes below the midpoint of the first candle’s body.
The formation becomes more meaningful when it coincides with resistance or an extended uptrend.
Best candlestick patterns for beginners
If you are just starting, focus on these six:
| Pattern | Type | Typical Context | Confirmation to Watch |
| Hammer | Bullish reversal | Downtrend/support | Bullish follow-through |
| Bullish Engulfing | Bullish reversal | Downtrend | Resistance break/volume |
| Morning Star | Bullish reversal | Downtrend | Third bullish candle |
| Shooting Star | Bearish reversal | Uptrend/resistance | Bearish follow-through |
| Bearish Engulfing | Bearish reversal | Uptrend | Support break |
| Doji | Indecision | Either trend | Next candle + structure |
These are useful candlestick patterns for beginners because they teach three fundamental ideas:
- Rejection
- Momentum transition
- Indecision
Master those concepts before adding obscure formations to your chart.
Which are the best candlestick patterns?
There is no universally reliable candlestick pattern.
This deserves emphasis because traders often search for the best candlestick patterns expecting a pattern with an automatic win rate.
Historical testing also shows why candlestick patterns should not be treated as universal signals.
A study published in Stocks & Commodities and hosted in Fidelity’s technical-analysis library tested more than 100 candlestick types using approximately 4.7 million daily price bars. The study measured subsequent price performance under specific market and testing conditions, including bull-market samples.
Its findings showed that some formations performed differently from their traditional bullish or bearish interpretations. These results should be treated as historical observations under the study’s methodology rather than guarantees of future performance.
The practical takeaway:
Pattern + location + trend + confirmation + risk management is more useful than pattern name alone.
A practical candlestick trading strategy
Here is a framework we prefer at Ruchir Gupta Training Academy.
Step 1: Identify the trend
Determine whether price is forming:
- Higher highs and higher lows
- Lower highs and lower lows
- A sideways range
Current Fidelity technical-analysis guidance similarly starts trend analysis with uptrends, downtrends and sideways trends.
Step 2: Mark important price levels
Identify:
- Support
- Resistance
- Previous high
- Previous low
- Breakout levels
- Gap zones
Step 3: Wait for the candlestick pattern
Now watch for a Hammer, Engulfing formation, Morning Star or another relevant pattern.
Step 4: Ask why it formed there
This is where chart reading begins.
A Bullish Engulfing pattern at support after a decline tells a more coherent story than one in the middle of nowhere.
Step 5: Look for confirmation
Confirmation could include:
- Volume expansion
- Break of the pattern high/low
- RSI or MACD confirmation
- Trend alignment
- Support/resistance reaction
- Follow-through candle
Step 6: Define invalidation
Ask:
At what price is my trading idea wrong?
Your stop should reflect the setup’s invalidation rather than how much money you emotionally feel comfortable losing.
Step 7: Calculate position size
Suppose:
Entry = ₹510
Stop = ₹500
Risk per share = ₹10
Maximum acceptable loss = ₹1,000.
Then:
Position Size = ₹1,000 ÷ ₹10 = 100 shares
That calculation matters more than whether the pattern has an impressive name.
Real-world example: Bullish Engulfing at support
Imagine a stock declining from ₹1,100 to ₹1,000.
₹1,000 was previously a major support zone.
Price reaches ₹1,005 and forms a bearish candle.
The following session opens at ₹998, initially looks weak, then buyers enter aggressively. Price closes at ₹1,025, producing a Bullish Engulfing pattern.
A beginner sees:
“Bullish Engulfing = BUY.”
A structured trader sees:
- Existing downtrend
- Major ₹1,000 support
- Failed move below support
- Bullish Engulfing candle
- Potential change in short-term momentum
- Need for confirmation
- Defined invalidation below the setup
That is the difference between memorising candles and reading price action.
Why candle size and wicks deserve attention
The shape itself can provide information beyond the pattern’s name.
A historical study published in Stocks & Commodities and hosted by Fidelity found that, across the candlestick types tested, unusually tall candles generally produced stronger subsequent moves than shorter versions. The same research reported an association between unusually long shadows and stronger subsequent moves across many of the formations it tested.
This supports a useful practical habit:
Do not just ask:
“Is this a Hammer?”
Ask:
“How significant is this Hammer relative to the candles around it?”
A tiny Hammer buried inside six equally small candles may carry different information from a large rejection candle appearing after aggressive selling into established support.
Trading psychology: The candle can be right and you can still trade it badly
Suppose you identify a valid breakout.
You enter.
Price moves slightly against you.
You panic and exit.
Then price rallies.
Next time, determined not to repeat the mistake, you refuse to exit when your stop is hit.
The loss becomes much larger.
This is why technical knowledge alone is insufficient.
At Ruchir Gupta Training Academy, our stock-market education covers technical analysis alongside risk management and market psychology. The academy’s material specifically describes technical analysis, trading strategies, risk management and market psychology as part of its training.
Ruchir Gupta’s mentoring approach also focuses on eliminating emotional trading, developing disciplined habits and using structured risk management.
Those principles become particularly relevant when a chart looks convincing.
Confidence in a pattern should never become an excuse for unlimited risk.
8 candlestick mistakes beginners should avoid
- Trading every pattern you identify. Most candles should result in no trade.
- Ignoring the preceding trend. A reversal pattern requires something meaningful to reverse.
- Ignoring support and resistance. Location can change the significance of the formation.
- Entering before the candle closes. The shape can change considerably before the selected period ends.
- Assuming Doji always means reversal. It primarily represents indecision.
- Using candles without risk management. Even strong setups fail.
- Taking oversized positions after several winning trades. Recent success does not make the next pattern certain.
- Revenge trading after a failed pattern. One stopped-out Hammer does not justify immediately buying the next candle.
Risk management when trading candlestick patterns
Before entering a trade, answer:
- What is the current trend?
- Where is support?
- Where is resistance?
- What pattern has formed?
- Why is the location relevant?
- Has the candle closed?
- Is there confirmation?
- Where is the setup invalidated?
- How much capital am I risking?
- What is my planned exit?
- Am I trading my setup or reacting to FOMO?
Stop orders can help implement risk controls, but traders should understand their mechanics. Updated Investor.gov guidance notes that when a stop price is reached, a standard stop order becomes a market order, so the eventual execution price can differ from the stop price.
Learn candlestick trading with Ruchir Gupta Training Academy
Learning ten candle names from an image is easy.
Reading them correctly while the market is moving and your capital is exposed is harder.
That is why our approach at Ruchir Gupta Training Academy connects candlestick analysis with price action, technical analysis, market psychology and capital protection.
Ruchir Gupta’s academy profile states more than 20 years of market experience, including six years of previous experience as a research analyst.
The academy’s learning material includes technical analysis, price action, risk management and practical market strategies, with live and recorded learning formats focused primarily on Indian markets including NSE and BSE.
Join a stock market course by Ruchir Gupta to learn intraday trading, options trading and technical analysis with live training and mentorship.
For students learning candlestick patterns for beginners, the objective should be to move from:
“What is this candle called?”
to:
“What does this candle tell me about buyers, sellers, trend, price rejection and risk?”
That is a much more useful trading question.
Conclusion
The most useful trading candlestick patterns are not necessarily the patterns with the most complicated names.
Start with:
- Hammer
- Inverted Hammer
- Bullish Engulfing
- Morning Star
- Piercing Line
- Shooting Star
- Bearish Engulfing
- Evening Star
- Doji
- Dark Cloud Cover
Then stop memorising for a moment.
Learn to interpret where the pattern formed, what trend preceded it, whether an important price level is nearby, what buyers and sellers appear to be doing, and where your trade thesis becomes invalid.
That is where candlestick analysis starts becoming useful.
At Ruchir Gupta Training Academy, our focus is on helping traders connect technical-analysis concepts with disciplined decision-making, risk management and market psychology rather than treating individual patterns as shortcuts to profits. The academy’s stated mentoring philosophy emphasizes discipline, structured risk management and independent market analysis.
A candlestick can show you what happened during a trading period.
Your job as a trader is to understand why that information is relevant in its current context and how much capital you are prepared to risk if your interpretation is wrong.