
How Many Candlestick Patterns Are There? ( Guide for Beginners & Traders 2026)
If you’re searching for how many candlestick patterns are there, you’re already on the right path to understanding the stock market.
Candlestick charts are not just colorful bars — they are powerful tools used by traders worldwide to understand price action, identify trends, and make better decisions.
But here’s the confusion most beginners face:
👉 There are too many patterns!
👉 Which ones actually work?
The truth is simple:
- There are 100+ trading candlestick patterns
- Only 10–20 types of candlestick patterns are essential
- Mastering a few can completely change your trading journey
In this guide, you’ll learn:
- How many candlestick patterns are there
- All major types of candlesticks
- Step-by-step how to read a candle chart
- Detailed explanation of trading candlestick patterns
- Real strategies used by professionals
Let’s break it down in the simplest way possible.
What Are Trading Candlestick Patterns?
Trading candlestick patterns are visual formations on a price chart that show how buyers and sellers interact.
Each candle represents:
- Opening price
- Closing price
- Highest price
- Lowest price
Think of it like a story:
- Buyers push price up
- Sellers push price down
- The candle shows who won
These patterns help traders:
- Identify trend direction
- Predict reversals
- Find entry and exit points
How Many Candlestick Patterns Are There?
This is the most searched question:
How many candlestick patterns are there?
👉 The answer:
Category | Number |
Total Candlestick Patterns | 100+ |
Commonly Used | 30+ |
High-Probability | 15–20 |
Beginner-Friendly | 5–10 |
💡 Important Insight:
You don’t need to learn all the patterns. Focus on high-probability trading candlestick patterns.
Types of Candlesticks Explained
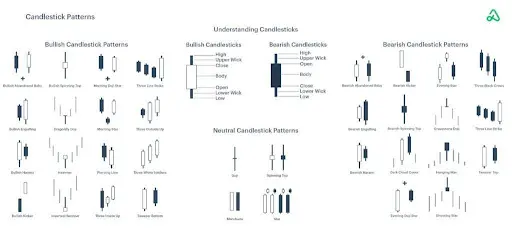
Understanding types of candlesticks is the foundation of trading.
Main Types of Candlesticks
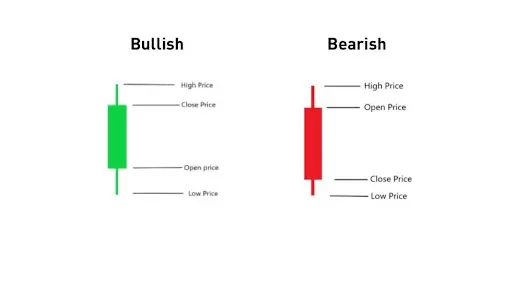
Bullish Candlestick
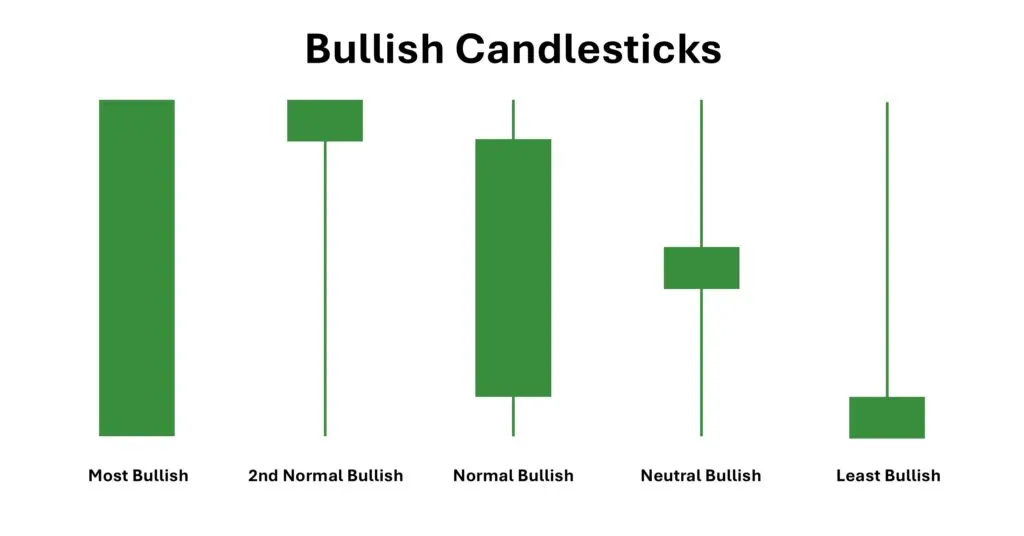
- Close price > Open price
- Indicates buying pressure
Bearish Candlestick
- Close price < Open price
- Indicates selling pressure
Doji Candlestick
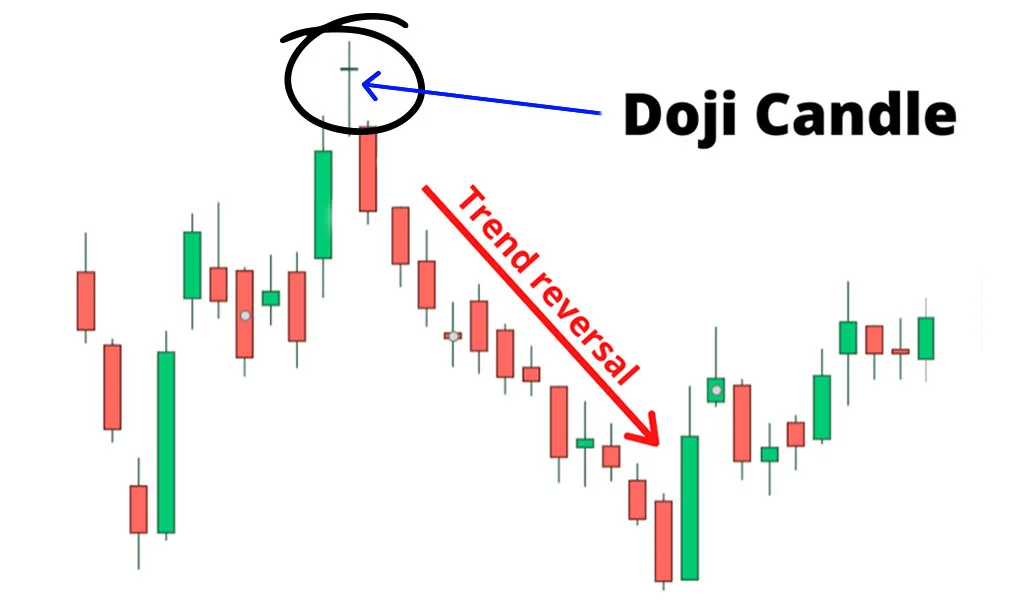
- Open ≈ Close
- Indicates indecision
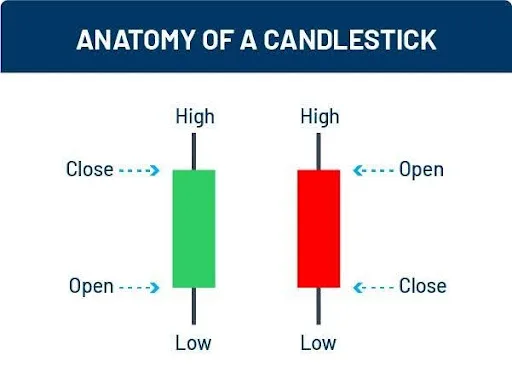
Key Components
- Body → strength
- Wick → rejection
How to Read a Candle Chart
If you don’t know how to read a candle chart, patterns won’t help.
Step-by-Step Process
- Identify the trend
- Mark support and resistance
- Look for candlestick patterns
- Confirm with volume or indicators
👉 Always remember:
Context is more important than pattern.
Single Candlestick Patterns
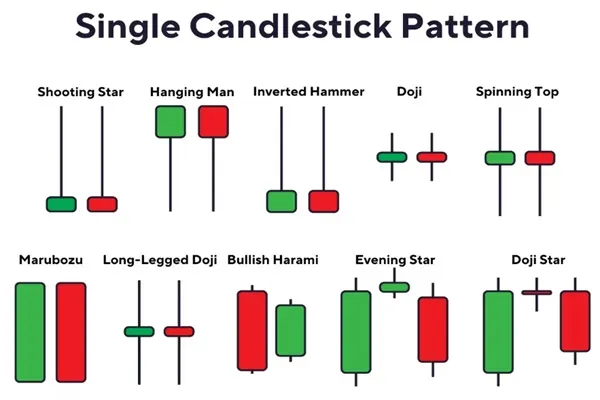
Important Single Candlestick Patterns
Hammer
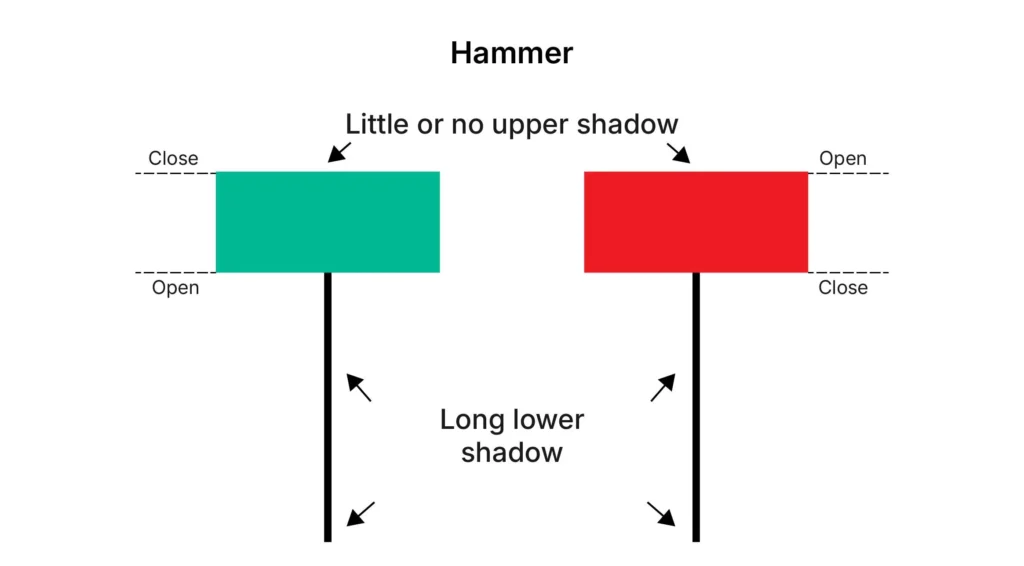
- Appears after downtrend
- Long lower wick
- Signal: Bullish reversal
Shooting Star
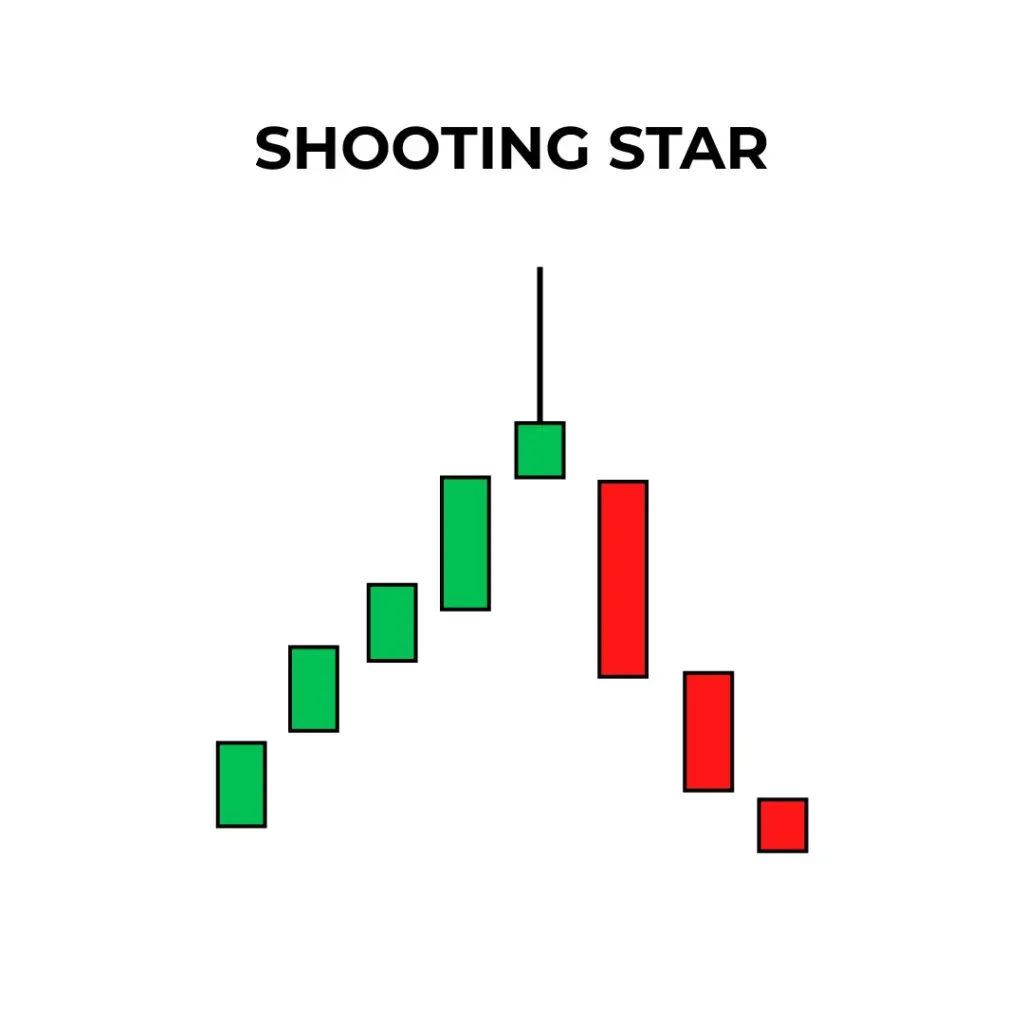
- Appears after uptrend
- Long upper wick
- Signal: Bearish reversal
Doji
- Market indecision
- Often before reversal
Marubozu
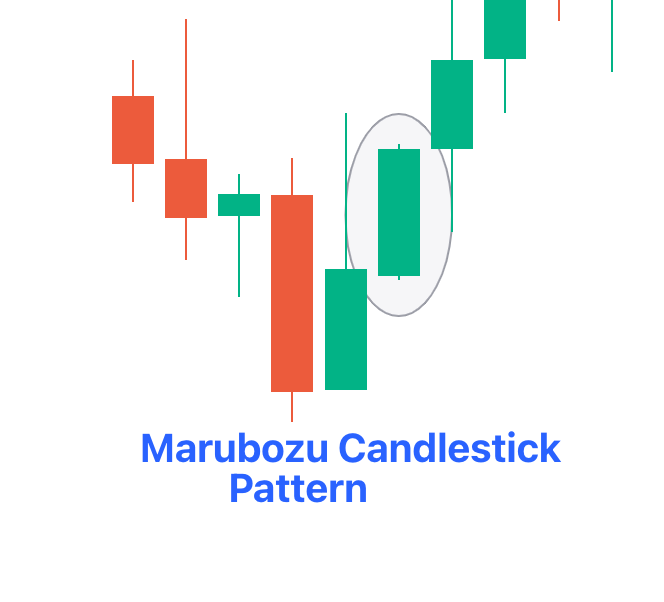
- Strong trend candle
- No wick
Double Candlestick Patterns
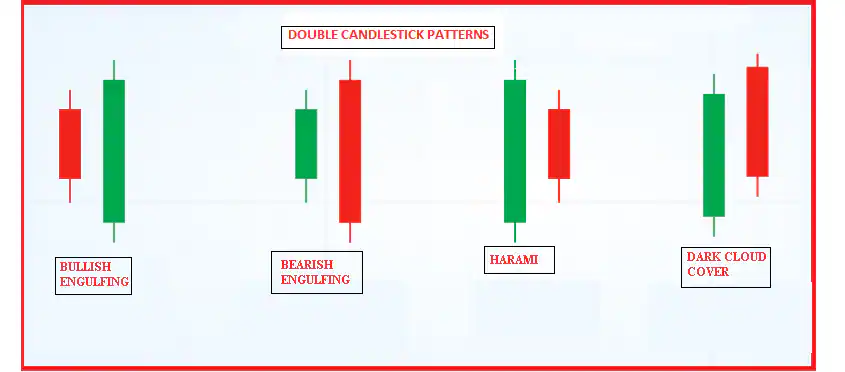
These trading candlestick patterns involve two candles.
Important Double Patterns
Bullish Engulfing
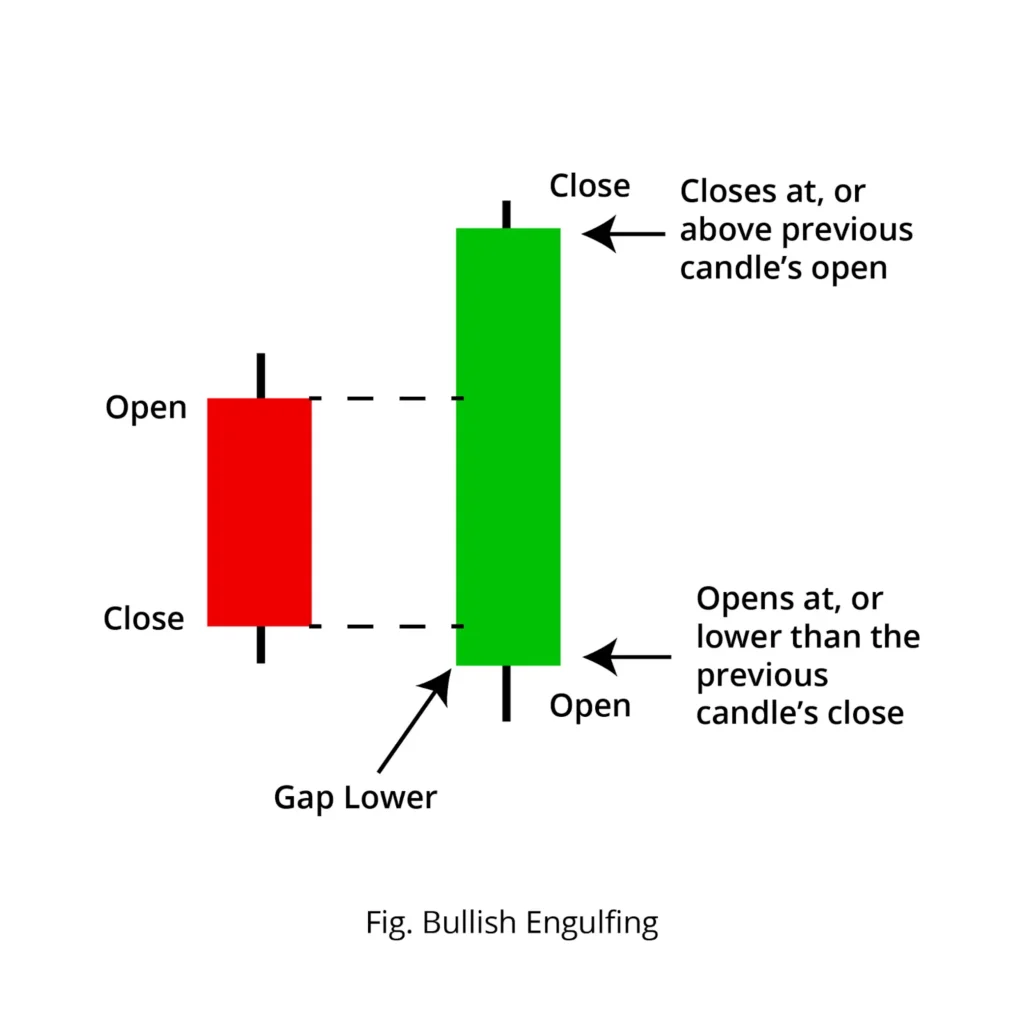
- Strong buying signal
Bearish Engulfing
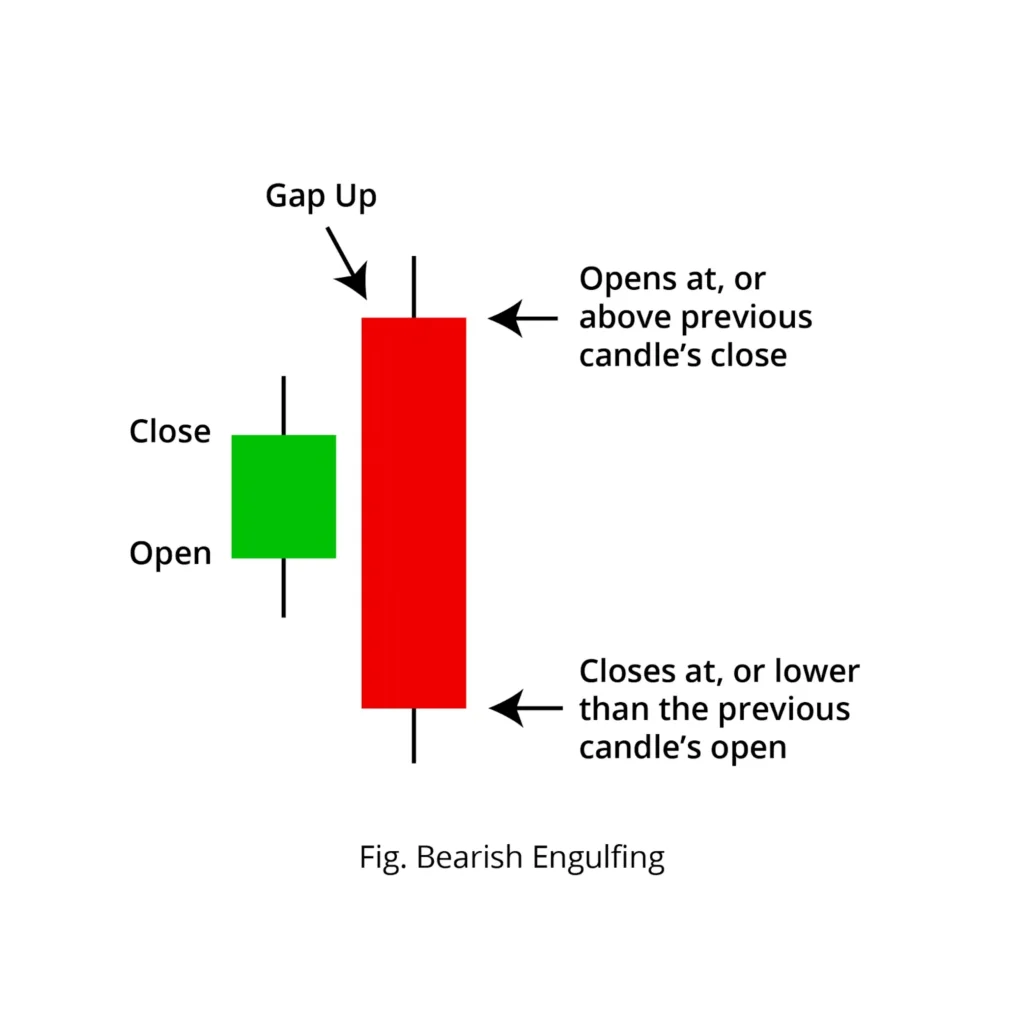
- Strong selling signal
Tweezer Top
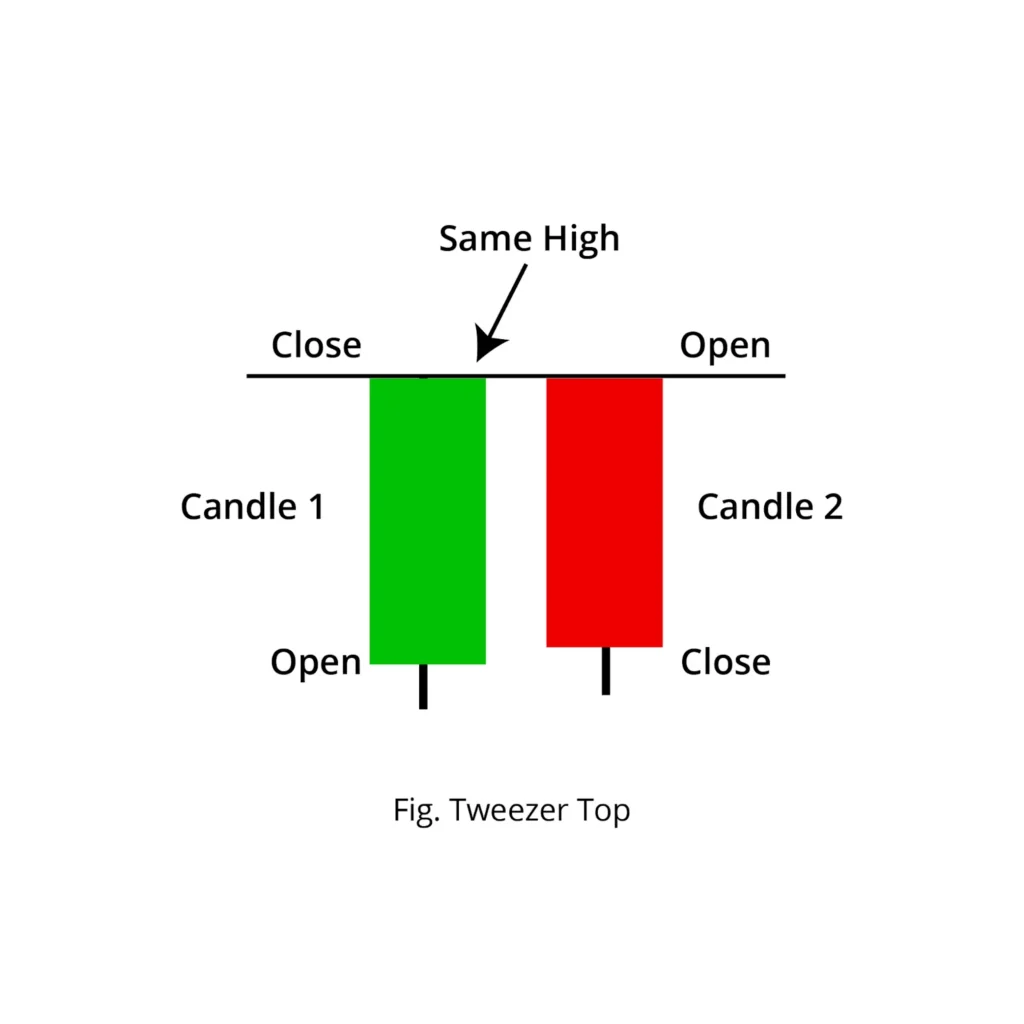
- Resistance signal
Tweezer Bottom
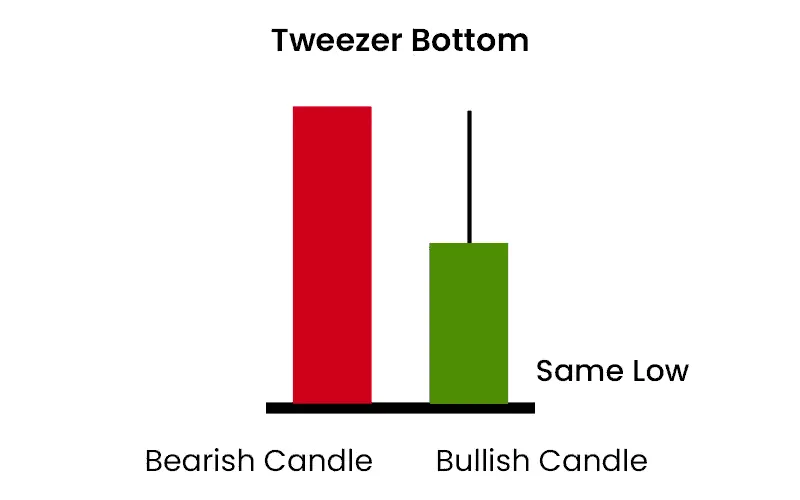
- Support signal
Triple Candlestick Patterns
These are powerful types of candlestick patterns.
Examples
Morning Star

- Bullish reversal
Evening Star

- Bearish reversal
Three White Soldiers
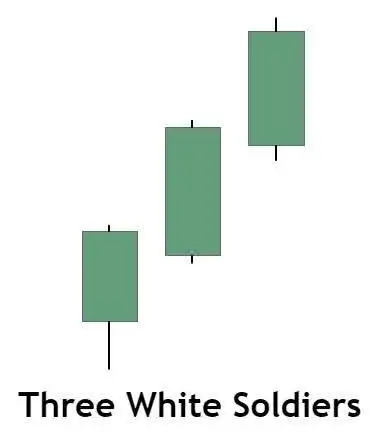
- Strong uptrend
Three Black Crows
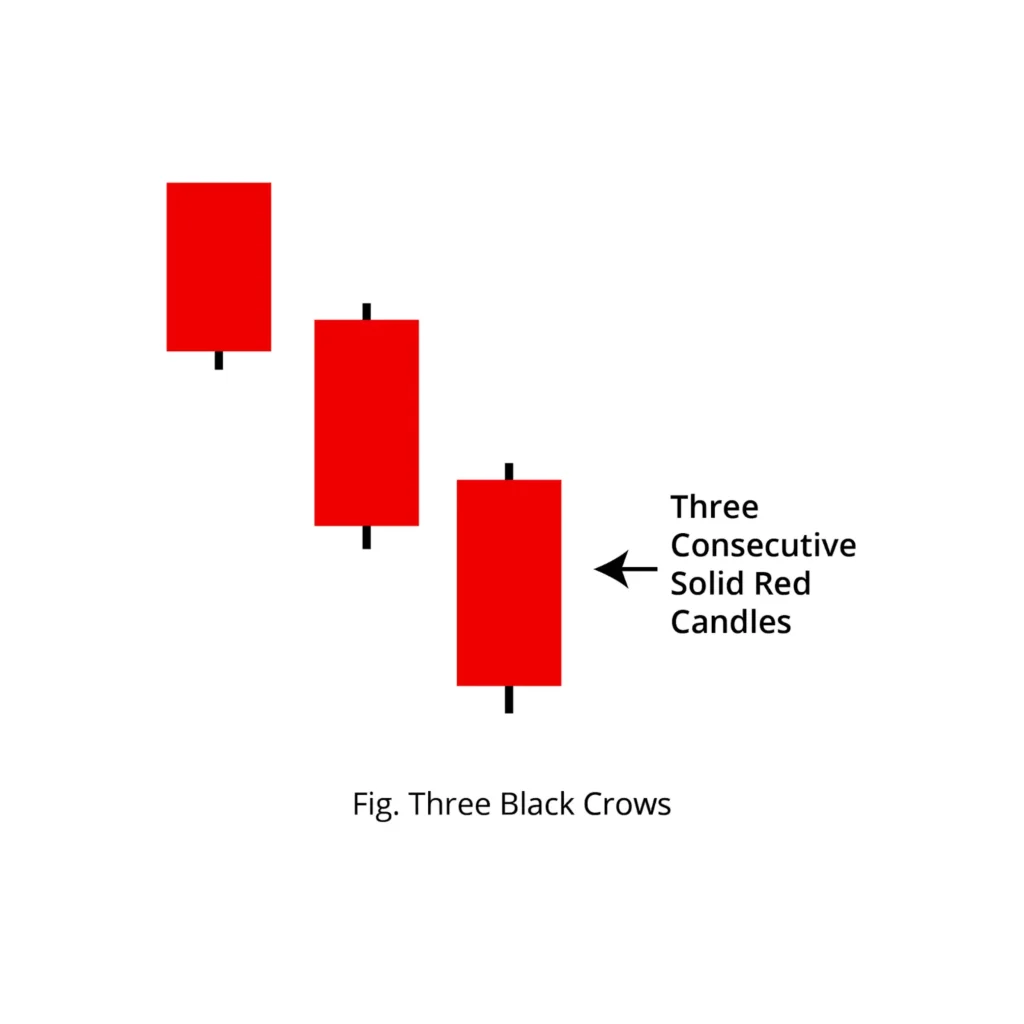
- Strong downtrend
Continuation Candlestick Patterns
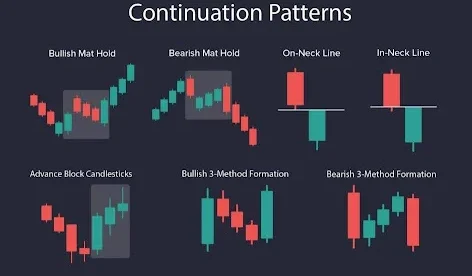
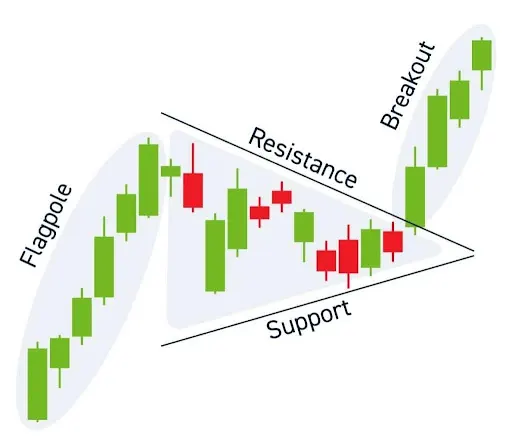
These patterns indicate trend continuation.
Examples
- Rising Three Methods
- Falling Three Methods
Reversal Candlestick Patterns
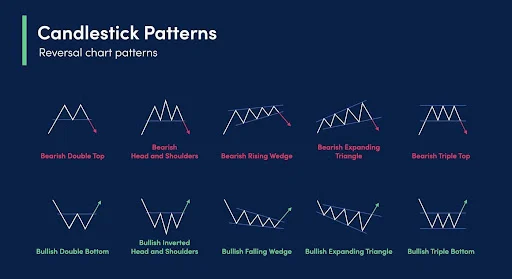
These patterns indicate trend reversal.
Examples
- Hammer
- Engulfing
- Doji
Rare Types of Candlestick Patterns
These are advanced patterns:
- Abandoned Baby
- Three Inside Up/Down
- Ladder Bottom
Accuracy of Candlestick Patterns (2026 Data)
Pattern | Accuracy |
Engulfing | 65–70% |
Morning Star | 70–75% |
Hammer | 60–65% |
Doji | 50–55% |
Combine patterns with indicators for better results.
Best Strategy Using Candlestick Patterns
Simple Trading Strategy
- Identify trend
- Wait for pattern
- Confirm with volume
- Enter trade
- Use stop loss
Common Mistakes
- Using too many patterns
- Ignoring trend
- No risk management
- Emotional trading
Learn from Expert Trader (Recommended)
If you want to master trading candlestick patterns, structured learning is essential.
One of the most trusted mentors is Ruchir Gupta, known as the Leading Stock Market Mentor, Coach & Trading Expert.
Why Choose Him?
- 20+ years experience
- 3 lakh+ traders trained
- Practical trading knowledge
- Real-time market learning
What You’ll Learn
- Technical analysis
- Risk management
- Trading psychology
- Live market execution
His Online Stock Market Courses are ideal for beginners and professionals.
conclusion
So, how many candlestick patterns are there?
Over 100 patterns exist
Only 10–20 are essential
Focus on:
- Understanding price action
- Practicing consistently
- Managing risk
Candlestick patterns are not magic — they are tools to understand market behavior.
conclusion
This article is for educational purposes only. Trading involves risk. Always do your own research before investing.
FAQ'S
How many candlestick patterns are there?
The number of patterns exceeds 100, 15-20 patterns are mostly used by the traders.
What are the best trading candlestick patterns?
The best are engulfing, Hammer and Morning Star.
What are the types of candlesticks?
The best are engulfing, Hammer and Morning Star.
How to read a candle chart easily?
Concentrate on trend, support/resistance, and patterns.
Are candlestick patterns useful for beginners?
Yes, they are among the simplest methods to get to know trading.