Technical indicators become dangerous when traders treat them like automatic buy-and-sell machines.
The Bollinger Bands indicator is a good example. A beginner sees price touch the lower band and immediately buys. Price touches the upper band, and the trader sells.
Then a strong trend begins.
Instead of reversing, price continues along the upper or lower band, leaving the trader trapped on the wrong side.
That is why understanding what is Bollinger Band, how volatility changes the bands, and how to combine the indicator with price structure is more useful than memorising a simple “lower band = buy” rule.
Bollinger Bands were developed by John Bollinger. The standard configuration remains a 20-period moving average surrounded by bands placed two standard deviations above and below that average. John Bollinger’s own explanation confirms that the default 20-period and ±2 standard-deviation configuration remains the conventional setup.
For traders in 2026-2027, Bollinger Bands can be particularly useful for studying volatility contraction, breakouts, trend continuation and relative price extremes.
Quick answer: What is the Bollinger Bands indicator?
The Bollinger Bands indicator is a volatility-based technical-analysis tool consisting of three lines: a middle moving average, an upper band and a lower band. The commonly used setting is a 20-period simple moving average with upper and lower bands positioned two standard deviations away from it.
Traders commonly use Bollinger Bands to study:
- Volatility
- Trend strength
- Price extremes
- Consolidation
- Breakouts
- Potential reversals
- Entry and exit zones
The indicator should generally be interpreted with price action, volume, momentum and market structure rather than as a standalone trading signal.
What is Bollinger Band?
Definition: Bollinger Bands are volatility envelopes positioned above and below a moving average. Their distance from the average is calculated using standard deviation, meaning the bands dynamically respond as market volatility changes.
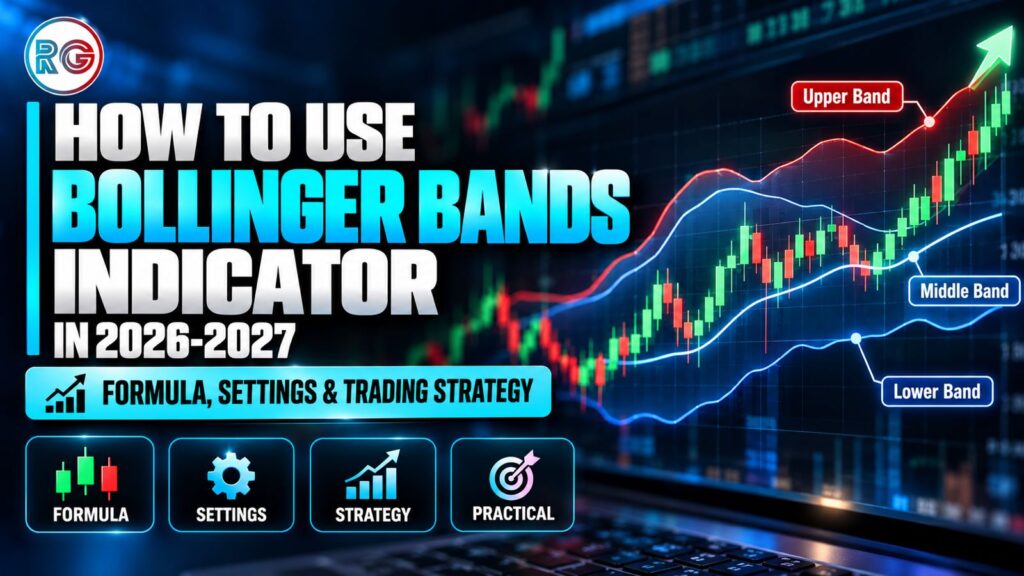
A Bollinger Bands chart contains three primary components:
| Component | Standard Setting | What It Shows |
| Upper Band | SMA + 2 standard deviations | Relative upper price zone |
| Middle Band | 20-period SMA | Average price/trend reference |
| Lower Band | SMA – 2 standard deviations | Relative lower price zone |
The important word here is relative.
Touching the upper band does not automatically mean a stock is “too expensive” and must fall.
Similarly, touching the lower band does not guarantee that price will recover.
During powerful trends, price can remain close to one band for extended periods. Fidelity’s technical-analysis guidance specifically notes that prices can exceed or hug a band for prolonged periods during strong trends.
That is one of the first lessons we want traders to understand at Ruchir Gupta Training Academy: indicators provide context. They should not replace structured analysis.
Bollinger Band formula explained simply
The standard Bollinger Band formula begins with a simple moving average.
Middle Band
Middle Band = 20-period Simple Moving Average (SMA)
Upper Band
Upper Band = 20-period SMA + (2 × Standard Deviation)
Lower Band
Lower Band = 20-period SMA – (2 × Standard Deviation)
Fidelity describes the calculation similarly: calculate the SMA and standard deviation over the same period, then add the chosen standard-deviation multiple for the upper band and subtract it for the lower band.
Why does standard deviation matter?
Standard deviation measures how dispersed prices are around their average.
When prices begin moving aggressively:
Standard deviation rises → bands widen.
When price becomes calmer:
Standard deviation falls → bands contract.
This makes Bollinger Bands adaptive.
They respond to volatility rather than maintaining a fixed distance from the moving average.
What are the best Bollinger Bands settings?
The standard setting is:
Period: 20
Standard deviation: 2
Moving average: SMA
John Bollinger states that the default remains 20 periods with bands positioned at plus and minus two standard deviations.
Other configurations can be explored depending on timeframe and strategy.
| Trading Style | Example Setting | Purpose |
| Short-term | 10 SMA, 1.5 SD | More responsive bands |
| Standard | 20 SMA, 2 SD | General-purpose setup |
| Longer-term | 50 SMA, 2.5 SD | Slower trend analysis |
These example configurations are also documented in Fidelity’s technical-indicator guidance.
Do not change the settings simply because a trade failed.
Constantly modifying indicators until historical charts appear perfect is a classic form of overfitting.
Start with the standard 20,2 configuration, understand how it behaves across different market conditions, then test any modification systematically.
How to use Bollinger Bands indicator
For beginners, there are five conditions worth learning.
1. Identify whether the bands are expanding or contracting
Look at the distance between the upper and lower bands.
Contracting bands
Narrow bands indicate declining volatility.
This often happens when price enters consolidation.
Expanding bands
Wide bands indicate increasing volatility.
The market is moving more aggressively.
A useful measurement is Bollinger Band Width:
Band Width = (Upper Band – Lower Band) ÷ Middle Band
Fidelity notes that lower Band Width represents lower volatility while increasing Band Width indicates rising volatility.
The important trading question becomes:
Is volatility contracting or expanding?
That question is often more useful than simply asking whether price touched a band.
Bollinger Bands Trading Strategy 1: The Squeeze
The Bollinger Band Squeeze is one of the indicator’s most closely watched setups.
It occurs when the upper and lower bands contract significantly.
Think of the market like a compressed spring.
Price has entered a relatively narrow range. Volatility has fallen. Buyers and sellers have temporarily reached an equilibrium.
Eventually that balance can break.
Fidelity notes that tightening bands during low volatility can precede a sharp move in either direction.
How traders can analyse a squeeze
- Find noticeably narrow Bollinger Bands.
- Mark nearby support and resistance.
- Wait rather than predicting direction.
- Watch for price to break the range.
- Check whether volume or momentum confirms the move.
- Define the invalidation level before entering.
- Size the position according to predetermined risk.
Important warning
A squeeze predicts potential volatility expansion, not direction.
That distinction can save traders from many bad positions.
A trader sees narrow bands and thinks:
“Breakout is coming, so I should buy.”
But the breakout can happen downward.
Let price provide directional evidence first.
Bollinger Bands Trading Strategy 2: Breakout Strategy
Consider a stock consolidating between ₹490 and ₹500.
The Bollinger Bands become progressively narrower.
Then price closes at ₹504 above resistance and the upper band while volume expands.
A trader might interpret this as evidence that:
- Consolidation has ended
- Volatility is expanding
- Resistance has broken
- Momentum favours buyers
The trade still needs an invalidation point.
For example:
Entry: ₹505
Stop-loss: ₹496
Risk per share: ₹9
If the trader’s maximum acceptable trade risk is ₹900:
Position size = ₹900 ÷ ₹9 = 100 shares
That calculation should happen before the trader starts thinking about profit.
A breakout can fail.
Schwab describes a squeeze approach in which traders may consider an entry above the upper band and place an initial stop beneath the breakout formation or lower band; the inverse framework can be applied to bearish setups.
Bollinger Bands Trading Strategy 3: Riding the Band
This is where many beginners misunderstand the indicator.
Imagine a stock moving:
₹500 → ₹510 → ₹523 → ₹540 → ₹557.
During the move, price repeatedly touches the upper Bollinger Band.
A beginner may think:
“Upper band means overbought. Time to short.”
That can be a costly assumption.
In a powerful uptrend, price can repeatedly “walk” the upper band.
Likewise, a strong downtrend can repeatedly track the lower band.
Fidelity notes that prices can hug the bands during strong trends and that movement outside the bands can sometimes indicate trend continuation.
Signs of an upper-band trend
Look for:
- Rising middle band
- Higher highs
- Higher lows
- Price repeatedly approaching the upper band
- Expanding bands
- Supporting momentum
- Strong breakout volume
The opposite characteristics can occur during a lower-band downtrend.
Bollinger Bands Trading Strategy 4: Mean Reversion
Bollinger Bands can be used as one component of a mean-reversion approach, particularly when price is moving within an established range.
Suppose a stock repeatedly trades between ₹950 and ₹1,000.
Price falls to ₹952 and touches the lower Bollinger Band near established support.
Instead of immediately buying, a disciplined trader could look for confirmation such as:
- Bullish reversal candle
- Support holding
- RSI recovering from a weak reading
- Price returning inside the band
- Improvement in volume
Some traders may use the middle band as a potential reference or target, but the appropriate target depends on the market structure and trading plan.
Why this strategy fails during trends
Mean reversion works differently in trending markets.
A stock can hit the lower band and continue falling.
That is why “buy lower band, sell upper band” is an incomplete Bollinger Bands trading strategy.
Market regime comes first.
Bollinger Bands + RSI strategy
Combining Bollinger Bands with RSI can add a momentum layer to the analysis.
RSI measures momentum on a 0-100 scale. Traditional reference levels are approximately 70 for overbought conditions and 30 for oversold conditions, although these readings do not guarantee reversals.
Potential bullish setup
Look for:
- Price near lower Bollinger Band
- Existing support
- RSI showing weak/oversold conditions
- Bullish reversal structure
- Price returning inside the band
Potential bearish setup
Look for:
- Price near upper Bollinger Band
- Existing resistance
- Elevated RSI
- Bearish reversal structure
- Price returning inside the band
Again, RSI above 70 does not automatically mean “sell.”
Strong trends can maintain extreme momentum readings for extended periods. Schwab specifically cautions that overbought or oversold readings can mislead traders during powerful trends.
Bollinger Bands strategy comparison
| Strategy | Market Condition | Main Signal | Confirmation |
| Bollinger Squeeze | Low volatility | Bands contract | Breakout + volume |
| Breakout | Trend beginning | Price exits band/range | Volume + structure |
| Band Walk | Strong trend | Price tracks one band | Higher highs/lows |
| Mean Reversion | Range | Price reaches extreme | Support/resistance |
| BB + RSI | Range/reversal | Band + momentum extreme | Price confirmation |
There is no single Bollinger Bands trading strategy that performs identically in every market condition.
The trader must first identify the environment.
A practical trading framework we teach traders
At Ruchir Gupta Training Academy, technical indicators are better treated as components of a decision-making framework rather than isolated signals.
Before considering a Bollinger Bands setup, ask:
Step 1: What is the broader trend?
Check whether the market is:
- Trending upward
- Trending downward
- Consolidating
Step 2: Where is price?
Identify:
- Support
- Resistance
- Previous swing high
- Previous swing low
- Breakout zone
Step 3: What are the bands doing?
Are they:
- Contracting?
- Expanding?
- Flat?
- Trending upward?
- Trending downward?
Step 4: Is momentum confirming price?
RSI, MACD, volume or price momentum can provide additional context.
Step 5: Where is the trade invalidated?
Determine the stop-loss before entry.
Step 6: How much capital are you risking?
Never let excitement over a breakout determine position size.
This is why Ruchir Gupta’s teaching approach places emphasis on technical analysis alongside risk management and market psychology. Ruchir Gupta Training Academy’s curriculum includes technical analysis, price action, risk management and practical market strategies.
Trading psychology: The indicator isn’t usually the biggest problem
Consider two traders watching exactly the same Bollinger Band breakout.
Trader A waits for confirmation, calculates position size and accepts beforehand that the setup can fail.
Trader B sees the breakout candle and immediately enters because he fears missing the move.
The indicator is identical.
Their behaviour is different.
When Trader B gets stopped out, he immediately enters again. The second position is larger because he wants to recover the first loss.
That is no longer technical analysis.
It is emotional trading.
At Ruchir Gupta Training Academy, the mentorship framework specifically emphasizes eliminating emotional trading, developing disciplined habits and structured risk management.
Ruchir Gupta’s academy material states that he has more than 20 years of market experience and previously spent six years working as a research analyst.
The practical lesson is straightforward:
Your indicator identifies conditions. Your trading rules control what you do with that information.
7 Bollinger Bands mistakes beginners should avoid
1. Buying every lower-band touch
Lower-band contact is not automatically bullish.
2. Selling every upper-band touch
Strong stocks can continue walking the upper band.
3. Predicting squeeze direction
A squeeze indicates low volatility. It does not tell you with certainty which direction the breakout will take.
4. Ignoring support and resistance
Indicators become more useful when interpreted alongside price structure.
5. Entering before confirmation
Many breakouts briefly cross a band and reverse.
6. Trading without a stop-loss framework
Even technically strong setups fail.
7. Using five indicators that measure similar things
More indicators do not automatically mean more confirmation.
Keep the chart understandable.
Bollinger Bands risk-management checklist
Before taking a trade, answer these questions:
- What market condition am I trading?
- What is my entry?
- What confirms the setup?
- Where is my stop-loss?
- How much money can I lose?
- What is my position size?
- Where could I take profit?
- What invalidates my analysis?
- Is major market news approaching?
- Am I following a plan or reacting emotionally?
If you cannot answer those questions, another indicator probably will not solve the problem.
Learn technical analysis with Ruchir Gupta Training Academy
Learning what is Bollinger Band takes a few minutes.
Learning when to use it and when to ignore its apparent signals takes considerably longer.
That distinction is why structured market education can help beginners avoid jumping from one indicator to another.
Join a stock market course by Ruchir Gupta to learn intraday trading, options trading and technical analysis with live training and mentorship.
At Ruchir Gupta Training Academy, students can learn technical analysis, price action, trading strategies, risk management and market psychology through structured stock-market programs. The academy provides live and recorded learning and focuses primarily on Indian markets such as NSE and BSE.
For traders learning Bollinger Bands, the goal should be to understand why volatility contracts, how price behaves when it expands and how risk should be managed when the expected move fails.
Conclusion
The Bollinger Bands indicator becomes much more useful when you stop asking, “Did price touch the band?” and start asking, “What is volatility telling me?”
Remember the basic framework:
- Start with the standard 20-period SMA and 2 standard deviations.
- Use contracting bands to identify declining volatility.
- Watch for volatility expansion after a squeeze.
- Do not automatically short the upper band or buy the lower band.
- Identify whether the market is trending or ranging.
- Combine Bollinger Bands with price structure, momentum or volume.
- Define your stop-loss and position size before entering.
- Never assume an indicator can guarantee the next price move.
The Bollinger Band formula is easy to learn. Using it with discipline is the harder part.
For traders who want to move beyond indicator-based guesswork, Ruchir Gupta Training Academy focuses on technical analysis, risk management, trading psychology and practical market application. The academy’s stated training philosophy emphasizes discipline over emotion, structured risk management and developing traders who can analyse markets independently.
The objective should never be to find a magical indicator.
It should be to build a repeatable process for reading price, controlling risk and making disciplined trading decisions.